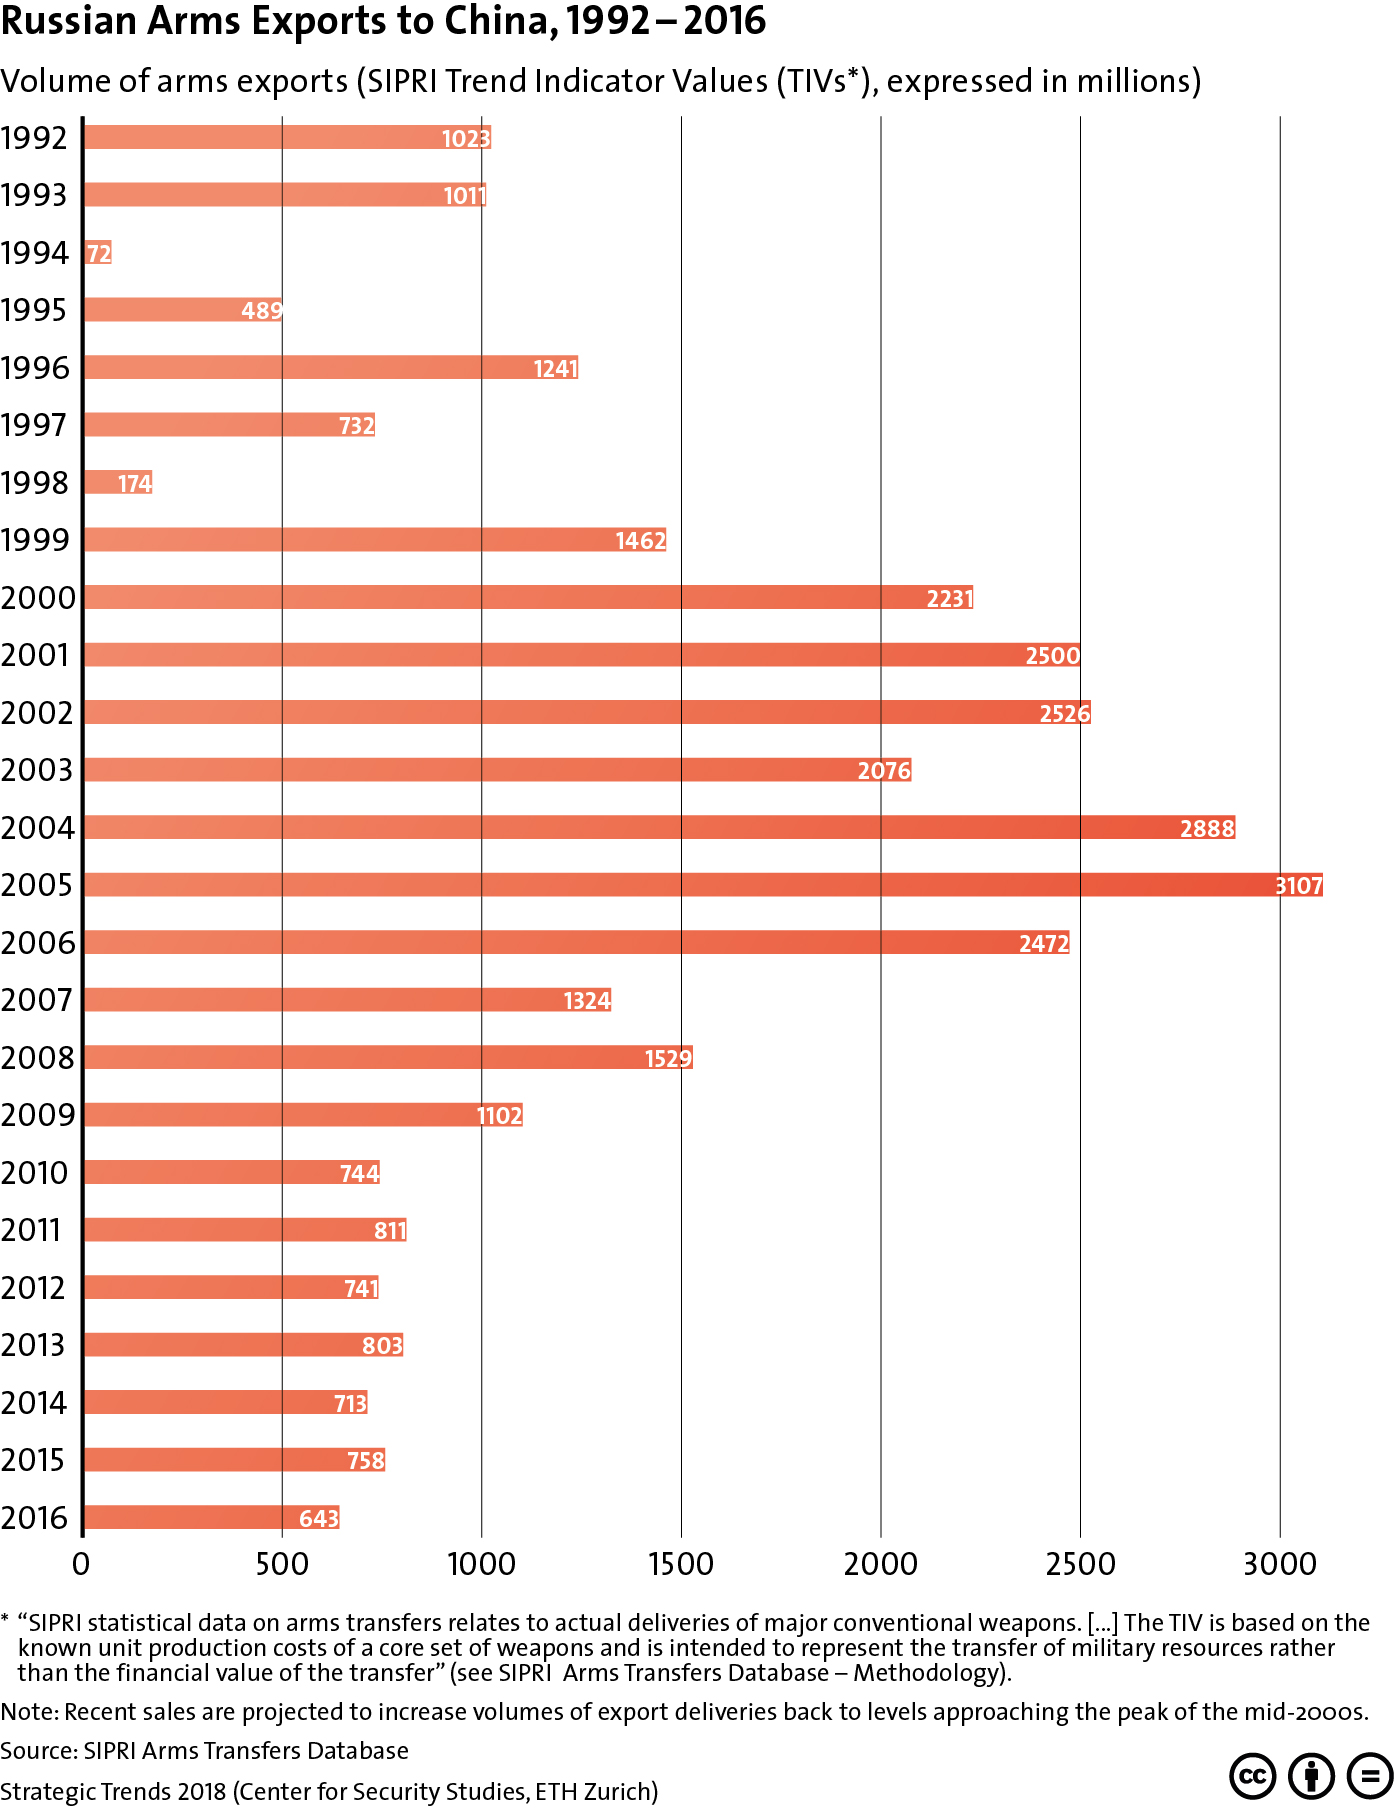
This graphic charts the volume of Russian arms exports to China from 1992-2016. For more on the strengthening China-Russia relationship, see Brian Carlson’s chapter for Strategic Trends 2018 here. For more CSS charts, maps and graphics on proliferation, click here.
Week: CSS Graphics
Graphics from the CSS
Main Migration Routes to Europe in 2017
This graphic maps the main routes of irregular migration into Europe during 2017 and the first half of 2018 as well as the top three nationalities of migrants using these routes. For more on changing migration trends and EU migration policy, see Lisa Watanabe’s latest addition to the CSS Analyses in Security Policy series here. For more CSS charts, maps and graphics, click here.
This graphic provides a timeline on the development of the areas of focus for cooperation in the Shanghai Cooperation Organisation (SCO) since the 1990s. For more on the SCO, its current and future relevance, and whether Europe should engage with the organization, see Linda Maduz’s comprehensive study Flexibility by Design. For more CSS charts, maps and graphics, click here.
This graphic groups the members of the UN Human Rights Council according to the state of freedom in these countries. For an account of the state of the protection of human rights around the globe and the UN’s role in protecting such rights, see Céline Barmet’s recent addition to the CSS’ Analyses in Security Policy series here. For more CSS charts, maps and graphics, click here.
This graphic plots the change in the perceived likelihood and impact of various societal, technological, geopolitical and environmental risks between 2012 and 2018. For more on resilience and the evolution of deterrence, see Tim Prior’s chapter for Strategic Trends 2018 here. For more CSS charts, maps and graphics on risk and resilience, click here.