Categories
CSS Blog Business and Finance

US Oil and Gas Production from 1980 – 2020

EmailFacebookTwitter

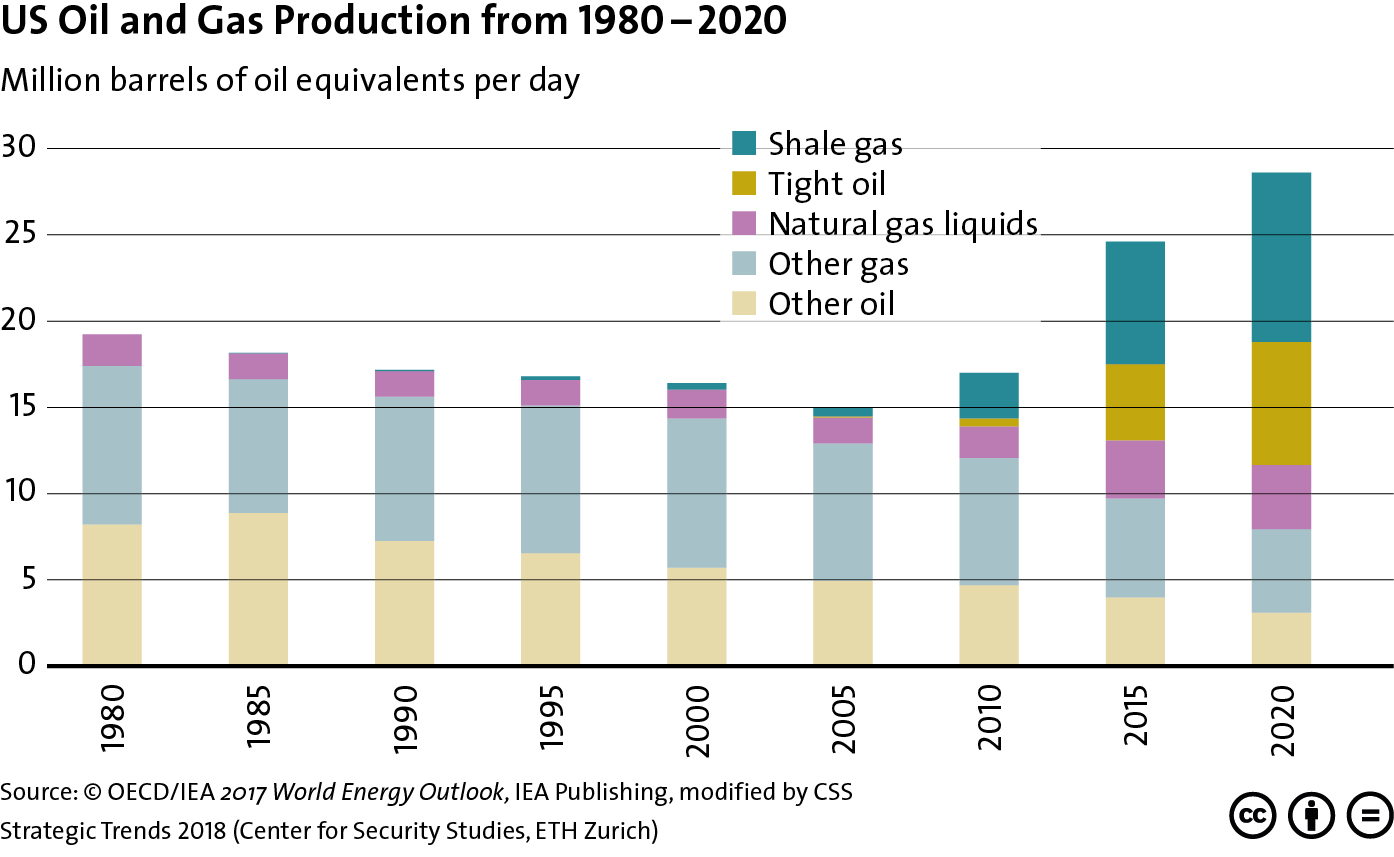
This graphic charts US oil and gas production from 1980 to 2015 and forecasts production up to 2020. For more on the interplay between technological innovation and the geopolitics of energy, see Severin Fischer ‘s chapter for Strategic Trends 2018 here. For more CSS charts, maps and graphics on natural resources, click here.

Categories
CSS Blog

Complex Adaptive Systems

EmailFacebookTwitter

This graphic depicts 1) the adaptive cycles that take place within complex systems, such as national and international security systems; and 2) how national security systems interact with international security systems. For more on this subject as well as the concept of resilience, see Tim Prior’s chapter for Strategic Trends 2018 here. For more CSS charts, maps and graphics click here.

Categories
CSS Blog Regional Stability

The EU Global Strategy Resilience Index

EmailFacebookTwitter

This graphic charts changes in resilience (using the EU’s definition of resilience) of select EU member states from 2015 to 2017. For more on the role of resilience in contemporary deterrence efforts, see Tim Prior’s chapter for Strategic Trends 2018 here. For more CSS charts, maps and graphics on defense policy, click here.

Categories
CSS Blog

Price Range of Electricity Costs by Source, 2010 and 2016

EmailFacebookTwitter

This graphic contrasts the price range of electricity costs stemming from renewable sources with that of fossil fuels for the years 2010 and 2016. For more on the interplay between technological innovation and the geopolitics of energy, see Severin Fischer’s chapter for Strategic Trends 2018 here. For more CSS charts, maps and graphics on economics, click here.

Categories
CSS Blog

US Soft Power Since 2012

EmailFacebookTwitter

This graphic looks German, Russian and Japanese public opinion of the US under the Obama and Trump administrations.For more on the US’ global leadership role, see Jack Thompson’s chapter for Strategic Trends 2018 here. For more CSS charts, maps and graphics, click here.