Categories
CSS Blog

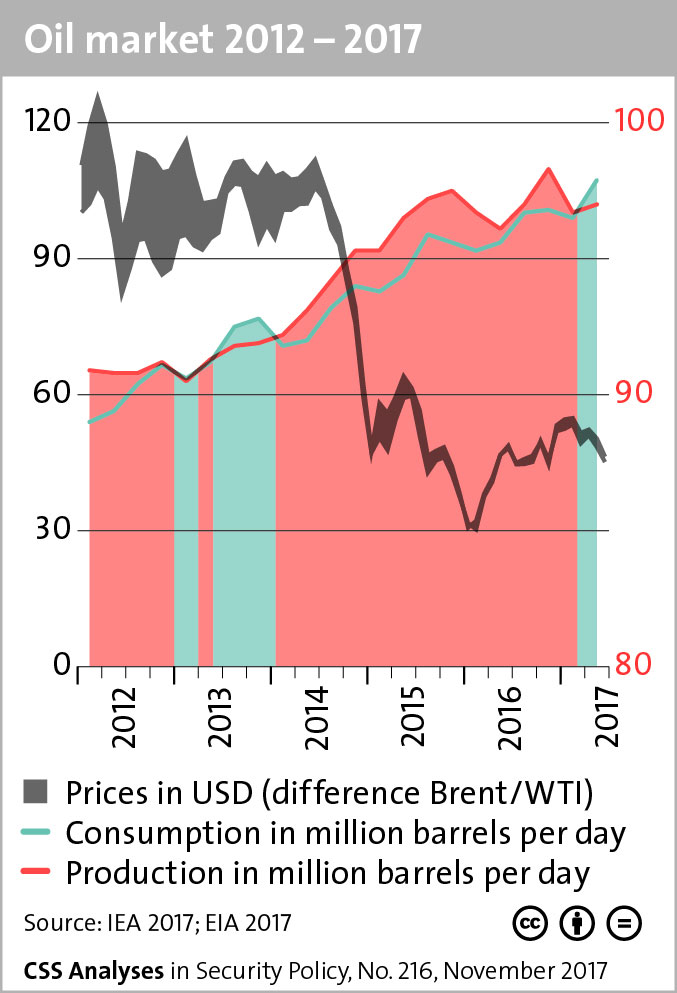
Oil Market 2012-2017

This graphic maps key indicators of the oil market in between 2012 – 2017. For more information on which trends will shape the oil market, check out this CSS analysis by Severin Fischer. For more graphics on natural resources, check out the CSS’ collection of graphs and charts on the subject here.

Categories
CSS Blog

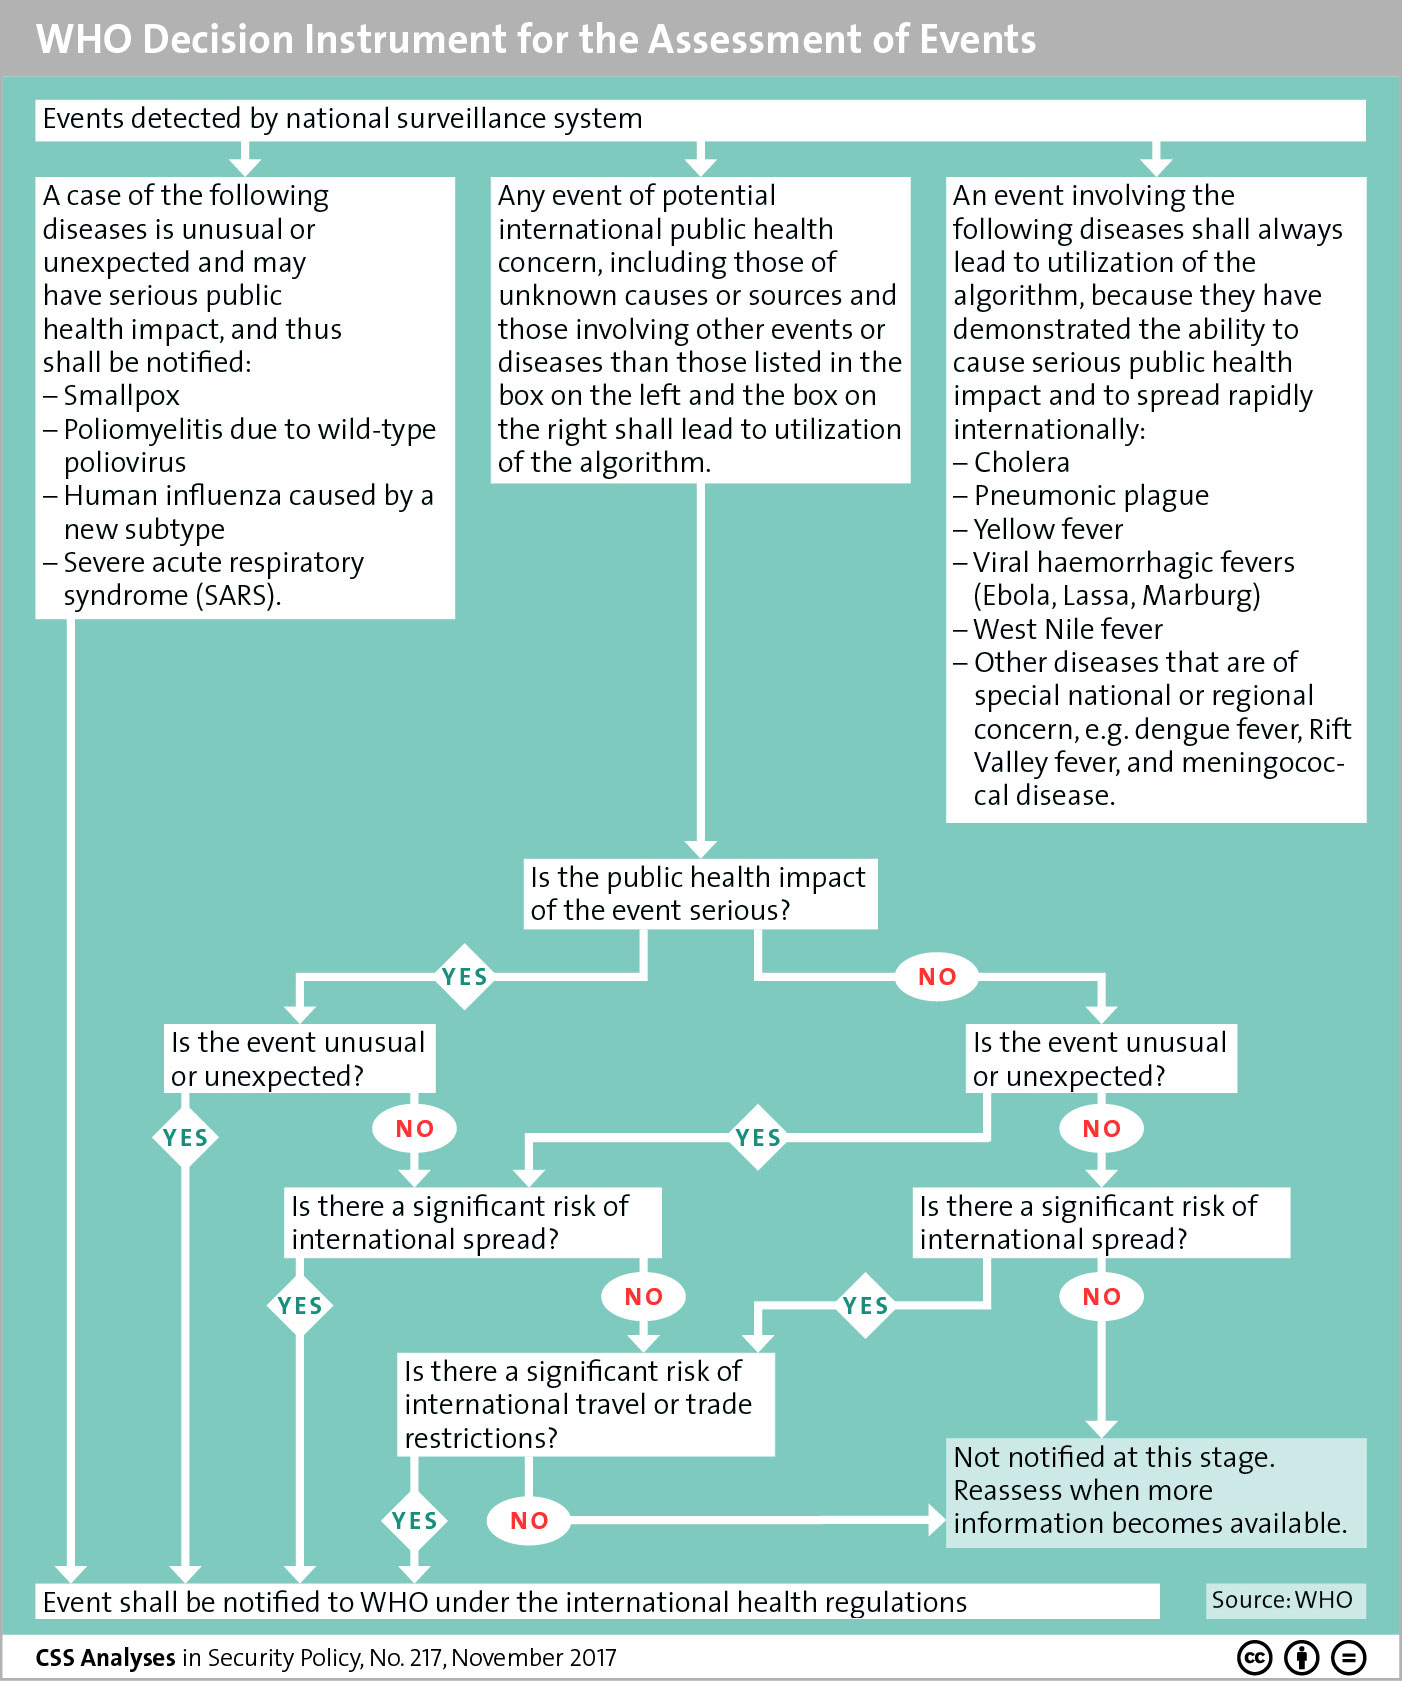
WHO Decision Instrument for the Assessment of Events

This graphic maps the World Health Organization’s decision instrument for the assessment and notification of events that may constitute a public health emergency of international concern. For more on how the WHO’s international health regulations aim to contain outbreaks in the early stages, see Ursula Jasper’s recent CSS analysis here. For more graphics on international organizations, check out the CSS’ collection of graphs and charts on the subject here.