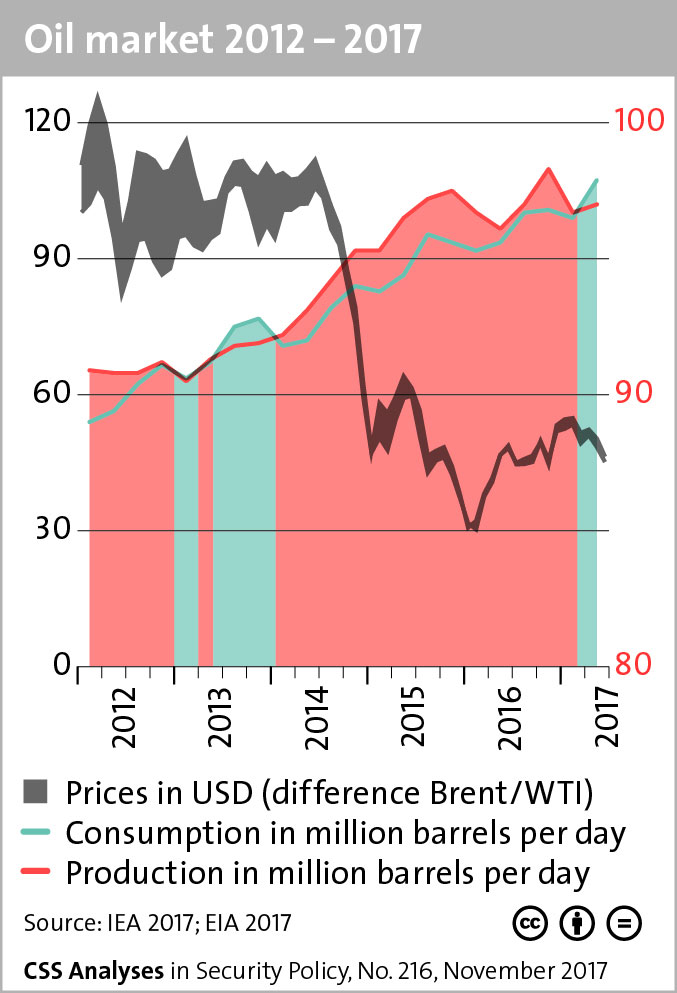
This graphic maps key indicators of the oil market in between 2012 – 2017. For more information on which trends will shape the oil market, check out this CSS analysis by Severin Fischer. For more graphics on natural resources, check out the CSS’ collection of graphs and charts on the subject here.