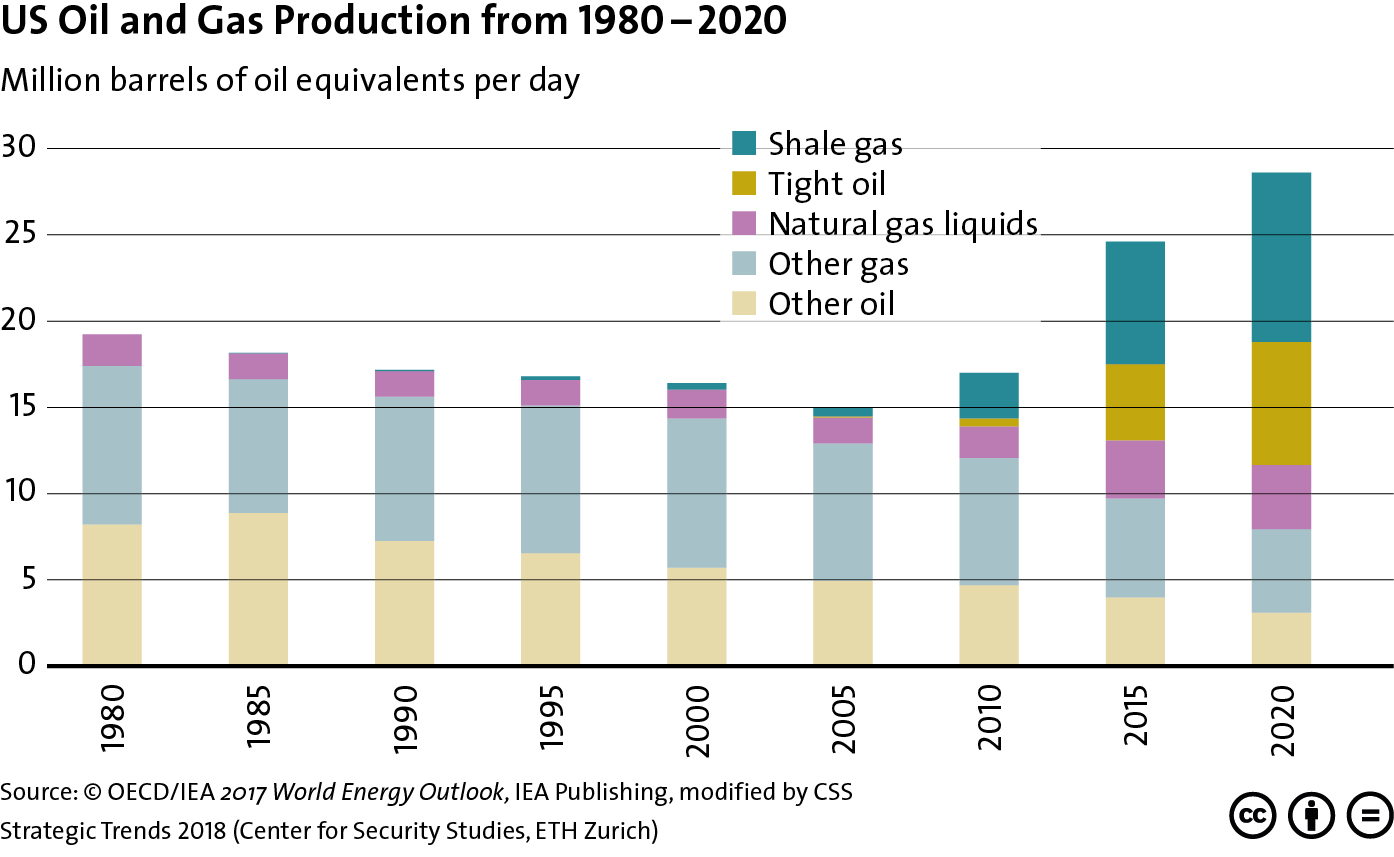
This graphic charts US oil and gas production from 1980 to 2015 and forecasts production up to 2020. For more on the interplay between technological innovation and the geopolitics of energy, see Severin Fischer ‘s chapter for Strategic Trends 2018 here. For more CSS charts, maps and graphics on natural resources, click here.


