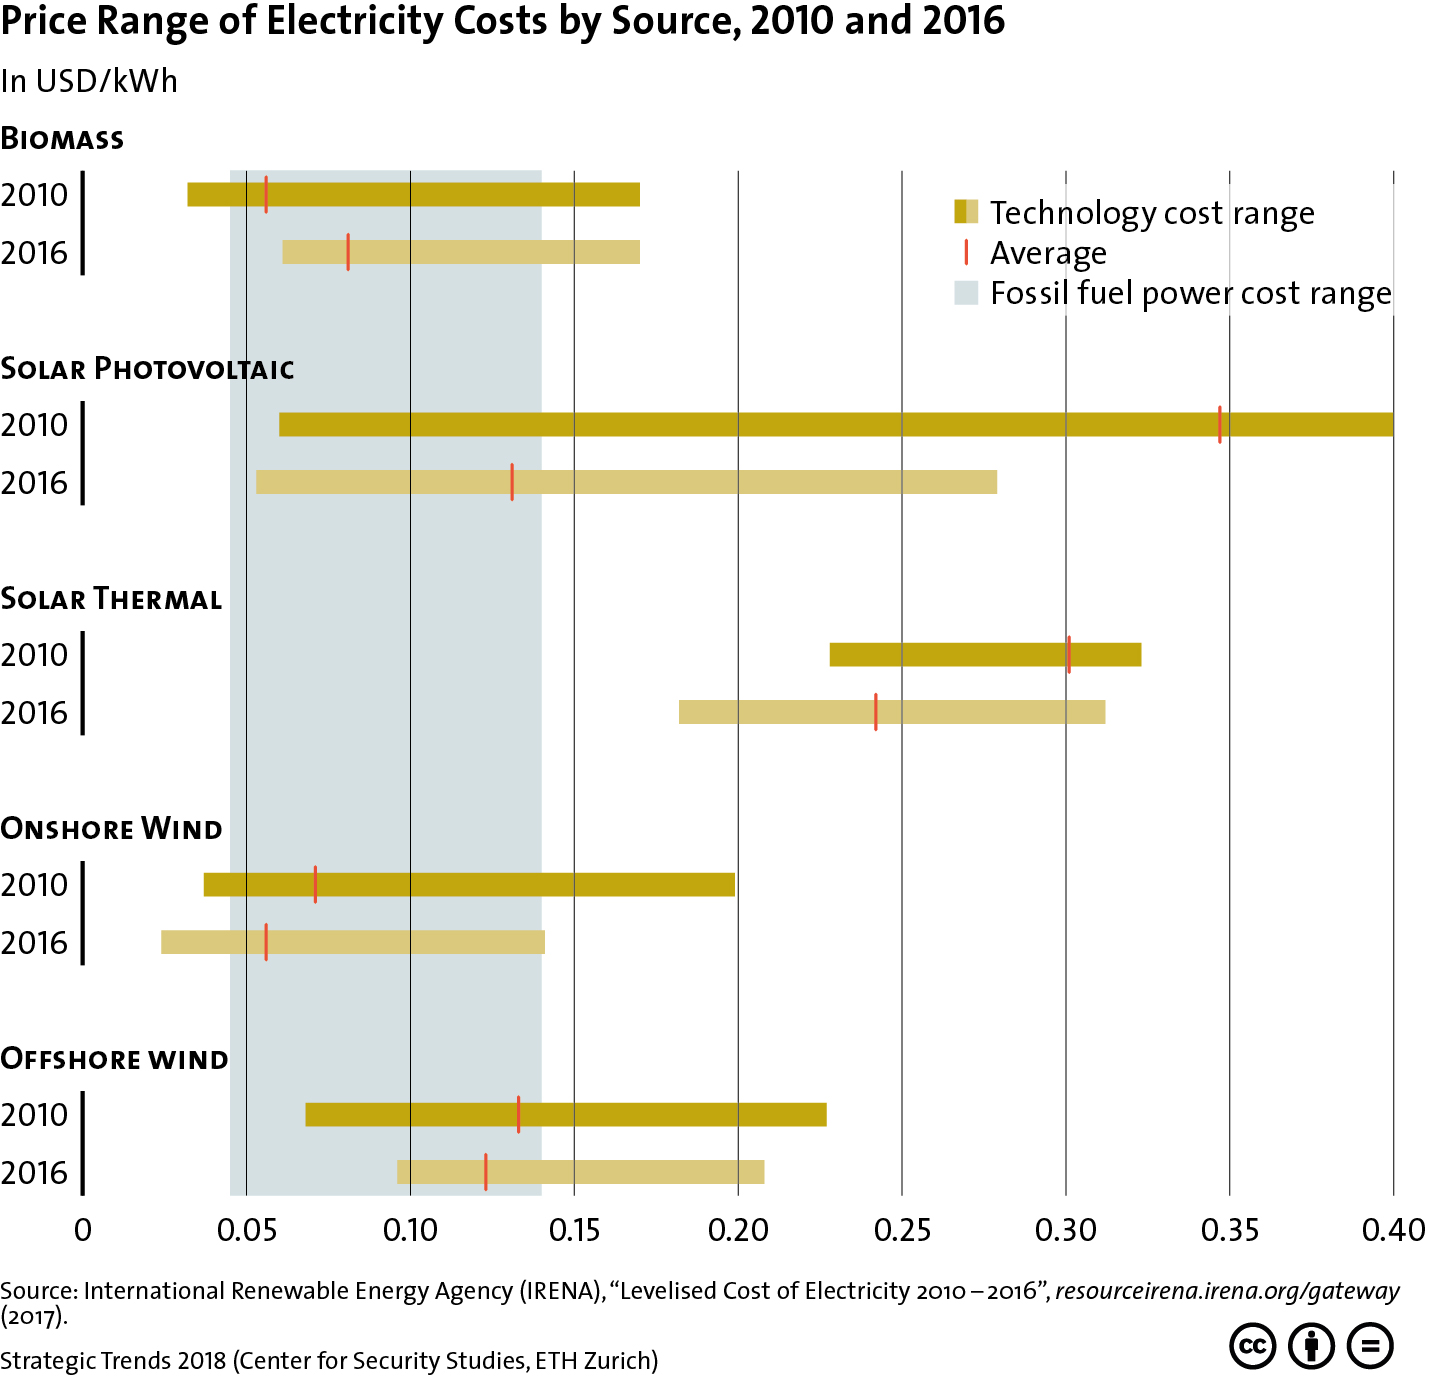
This graphic contrasts the price range of electricity costs stemming from renewable sources with that of fossil fuels for the years 2010 and 2016. For more on the interplay between technological innovation and the geopolitics of energy, see Severin Fischer’s chapter for Strategic Trends 2018 here. For more CSS charts, maps and graphics on economics, click here.
Countries look forward to attract investment. Photo: Tim Snell/Flickr
Scotland and Albania want to produce 100% of their electricity from renewable sources by 2020. Their commitment, both prime ministers argue, is not only a huge step towards a more sustainable society but will also comprise the creation of thousands of “green collar” jobs. This is good news for the environment and also for their respective populations. But with little more than 8 years to go, isn’t this target too ambitious for the nations’ actual capacities?
The governments’ announcements come at a crucial moment. Investors have started to shift their business to China, and last month a report by the group CBI warned that the United Kingdom was not attractive for investment in renewables. But the recent disaster at the Fukushima nuclear plants and the long-standing urge for clean energies have shifted public opinion in Europe to make way for a new reality. A second green revolution is building as European countries renew their commitment to clean energies as the way forward.