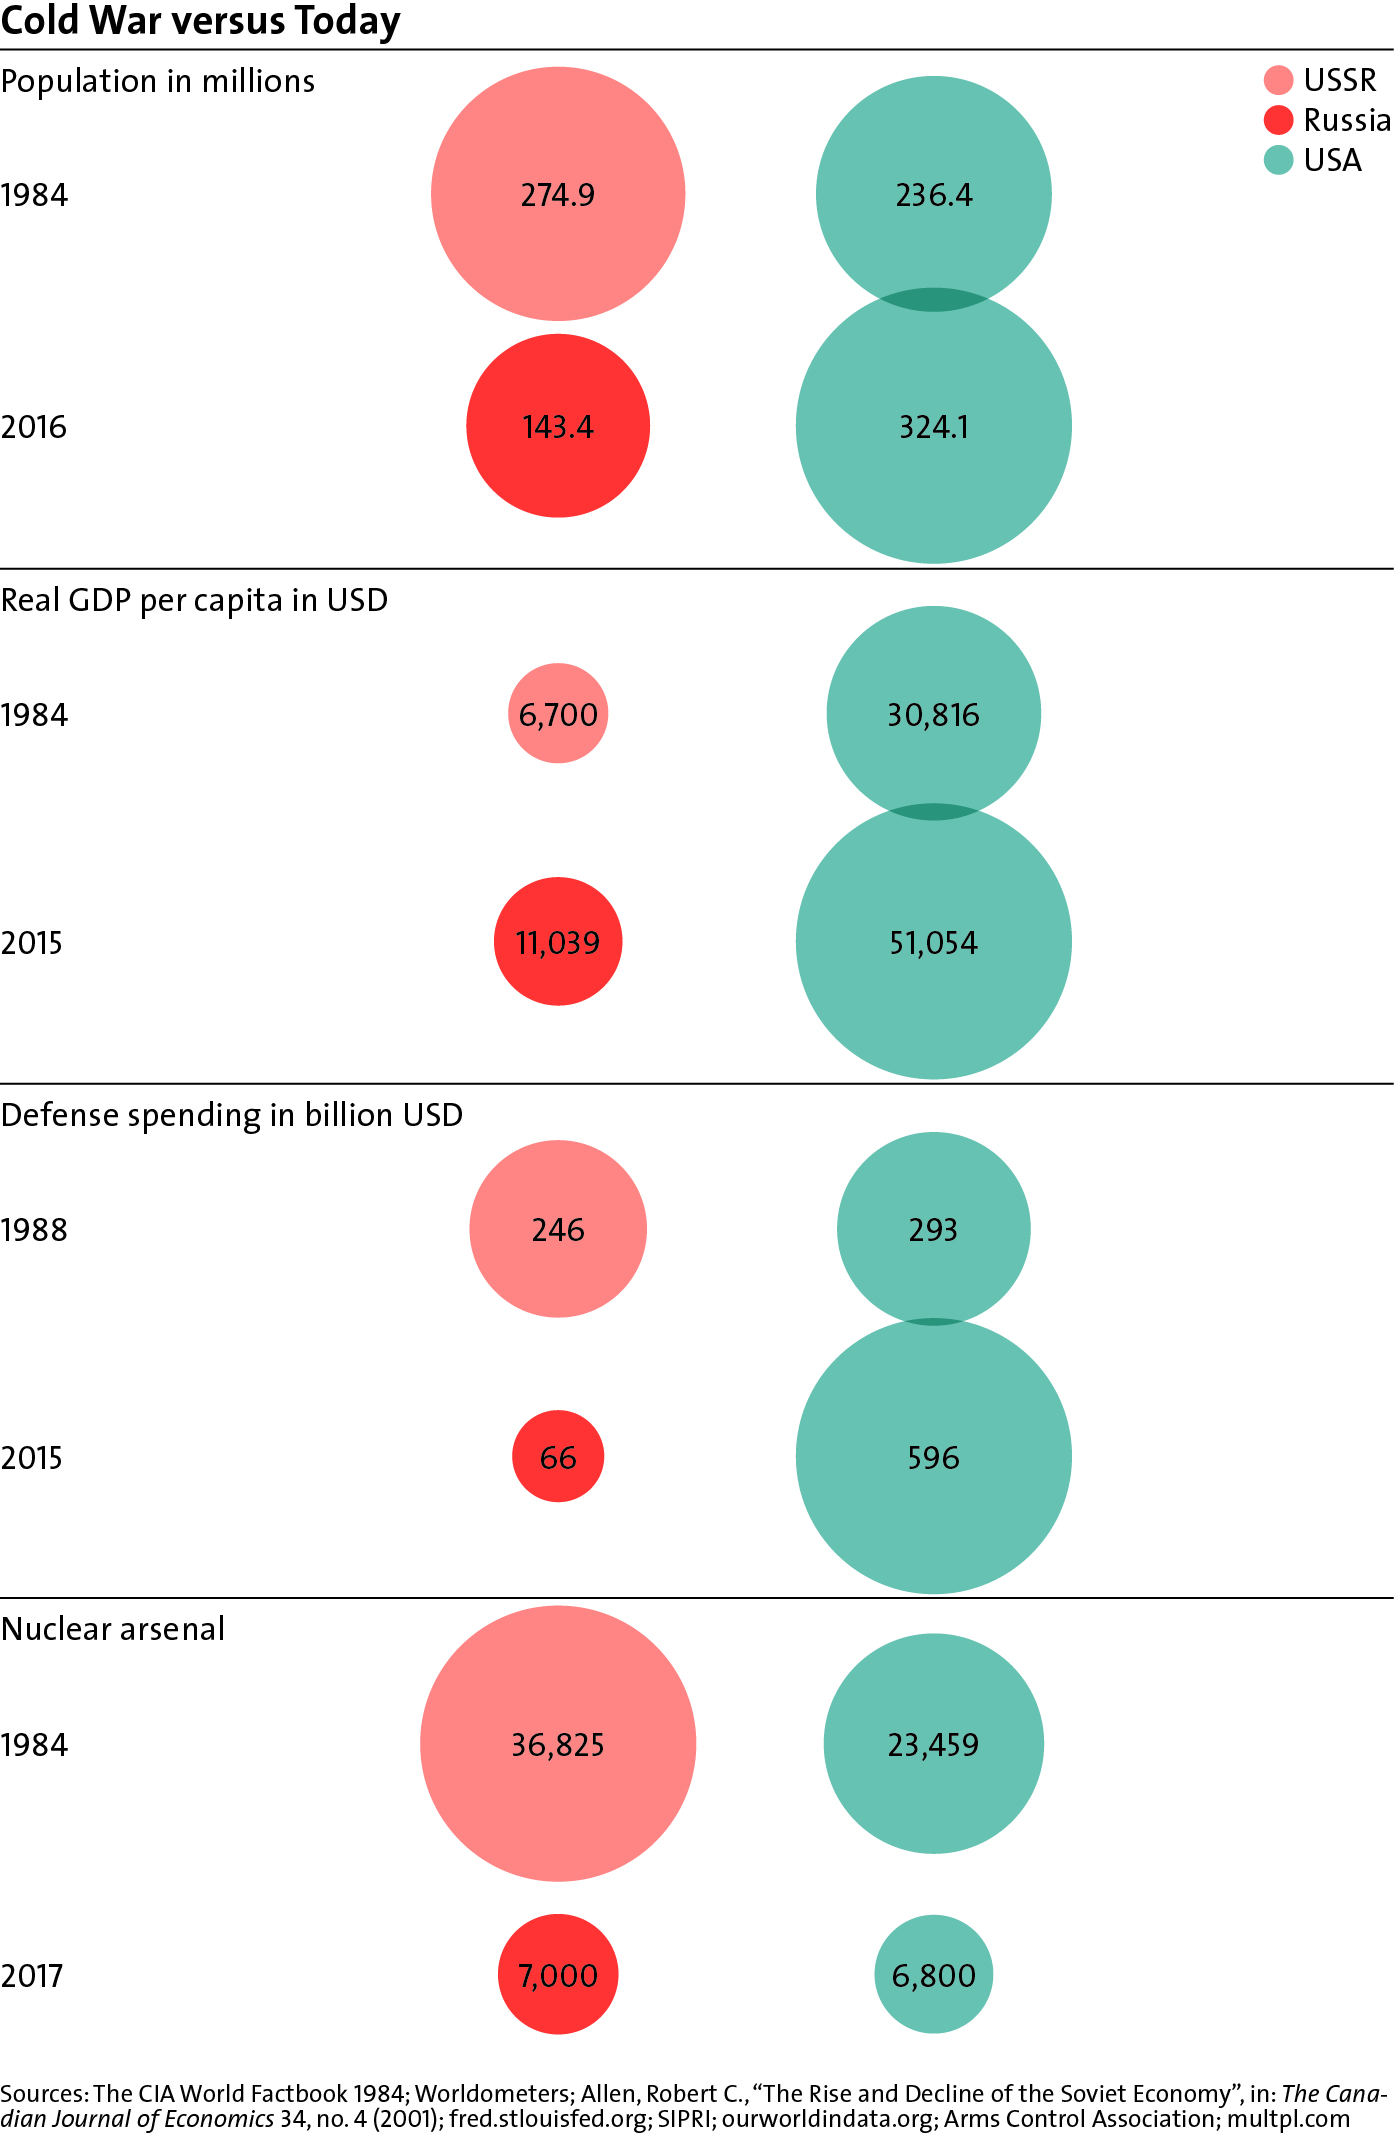
This graphic shows how the USSR compared to the US in terms of population, real GDP per capita (USD), defense spending (in billion USD) and nuclear weapons in the 1980s, as well as how the US compares to Russia in these key areas today. For an analysis of how different interpretations of the recent past still affect West-Russia relations and what is needed to rebuild trust, see Christian Nünlist’s chapter in Strategic Trends 2017 here. For more CSS charts and graphics, click here.
the Center for Security Studies
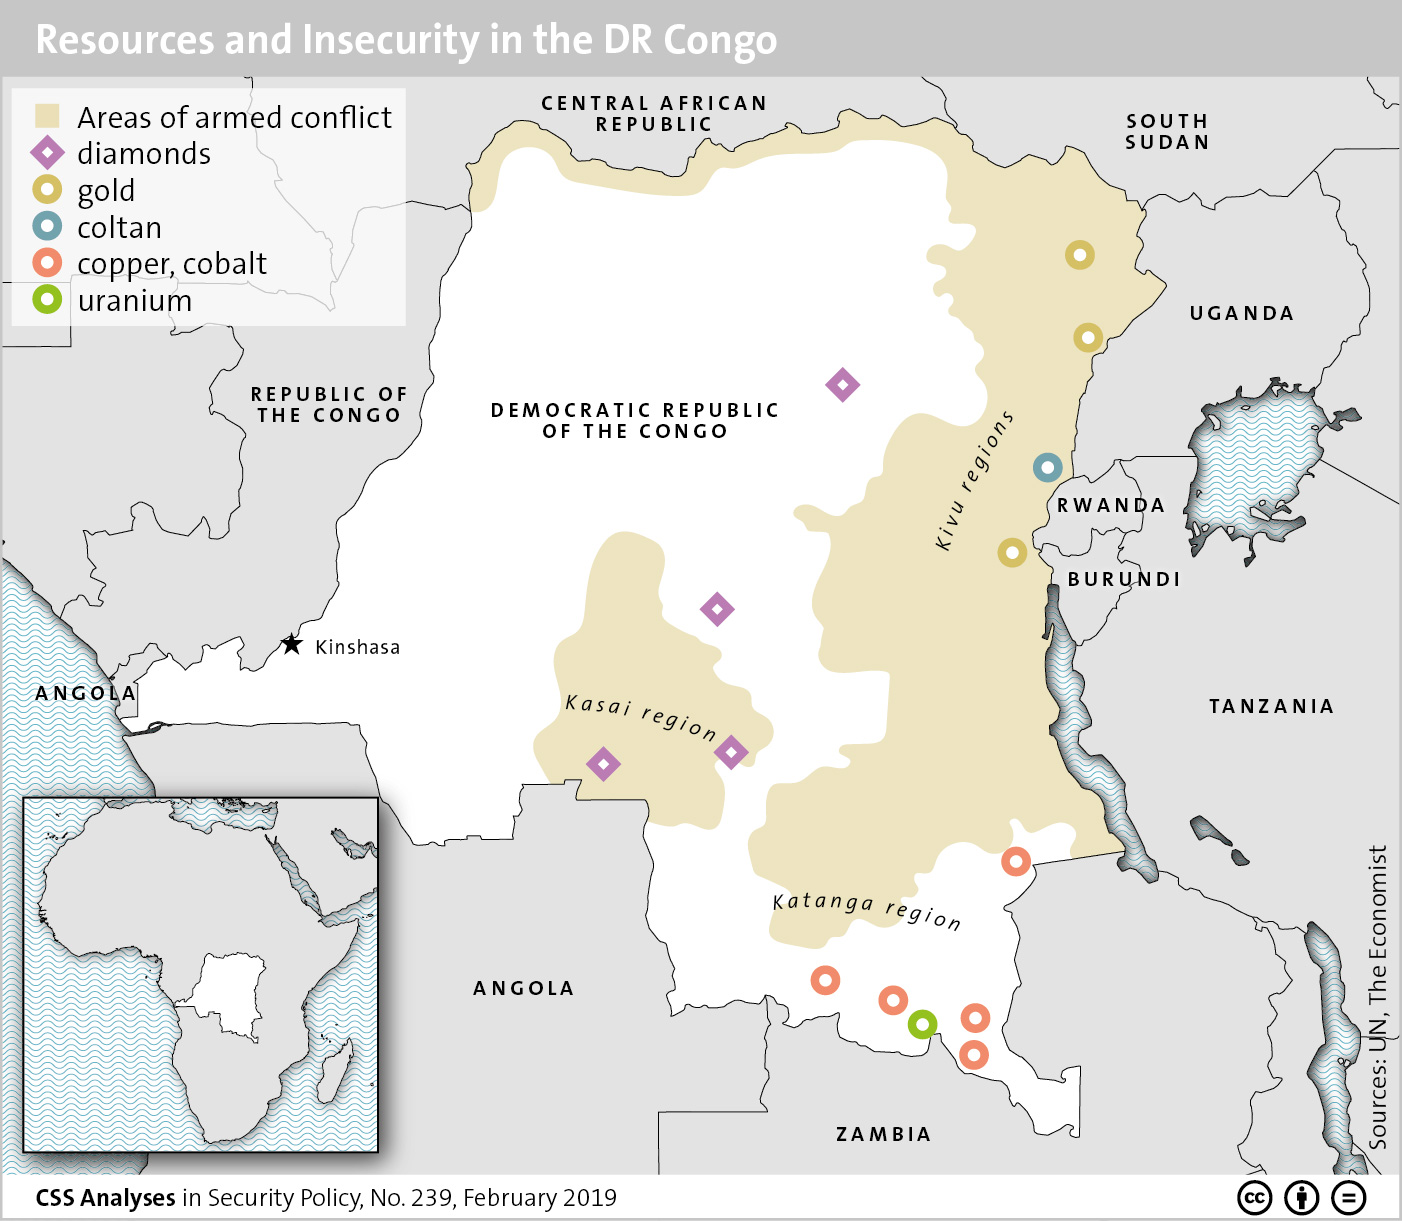
This graphic maps areas of conflict in the Democratic Republic of the Congo (DRC) and how they overlap with key natural resources found in the country. For an analysis of the political system in the DRC and its ramifications for security governance and economics, see Larissa Jäger and Benno Zogg’s lastest addition to the CSS’ Analyses in Security Policy series here. For more CSS charts and graphics, click here.
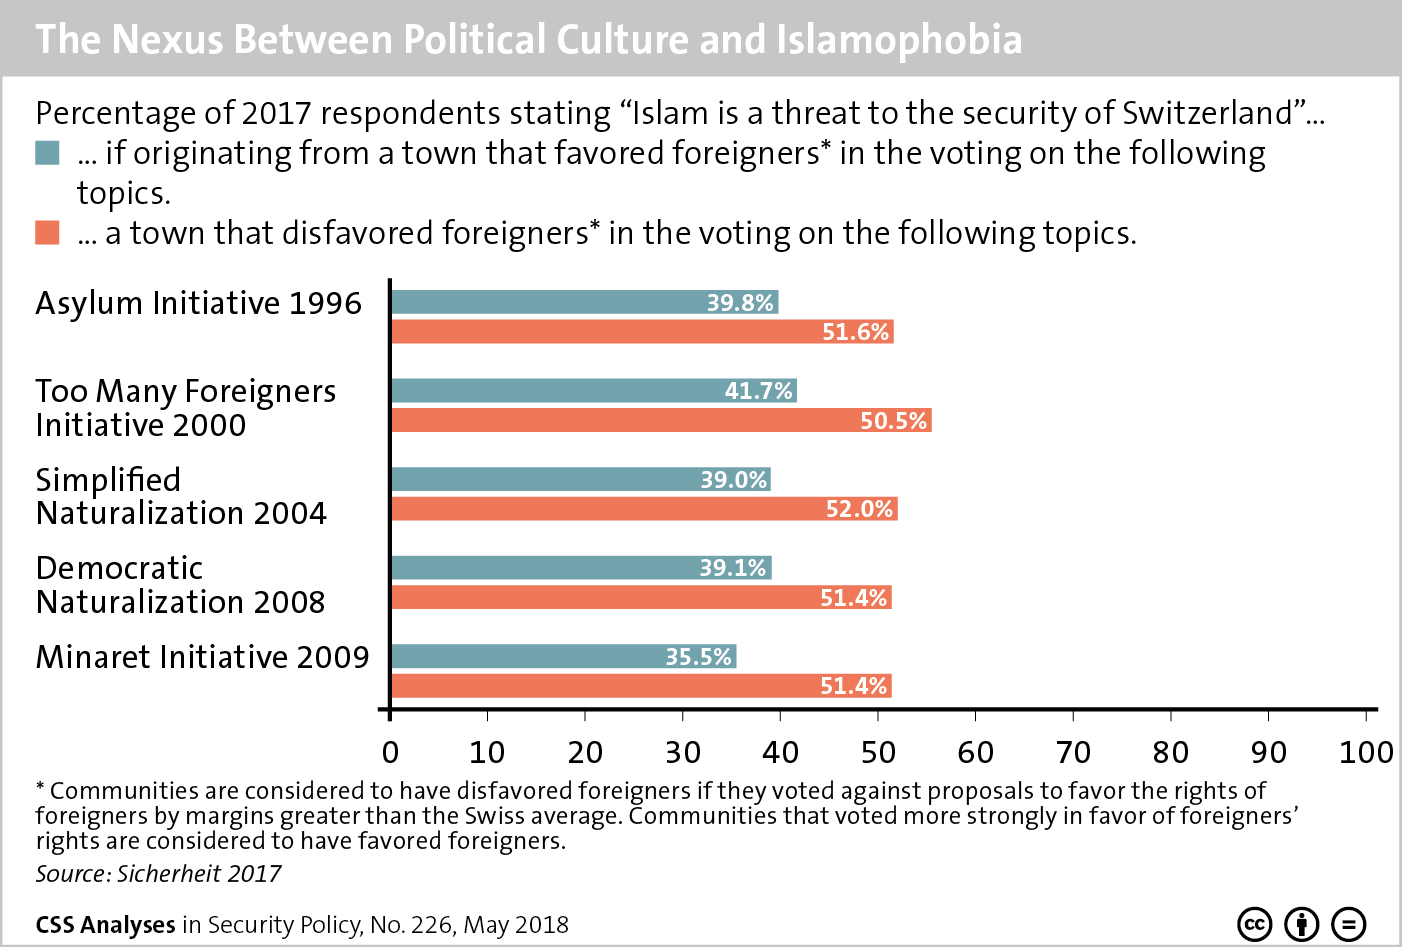
This graphic highlights the connection between political sentiment and Islamophobia in Switzerland. To find out more about views on Islam in times of terrorism, see Darius Farman and Enzo Nussio’s addition to the CSS’ Analyses in Security Policy series here. For more CSS charts and graphics, click here.

The World Economic Forum’s (WEF) annual meeting brings together global leaders from governments, companies, science and international organizations as well as societal actors. Three members of the CSS attended this year’s WEF in Davos. While Myriam Dunn Cavelty and Matteo Bonfanti joined discussions on different aspects of cybersecurity, Sophie Fischer presented on the role of Artificial Intelligence (AI) in international politics.
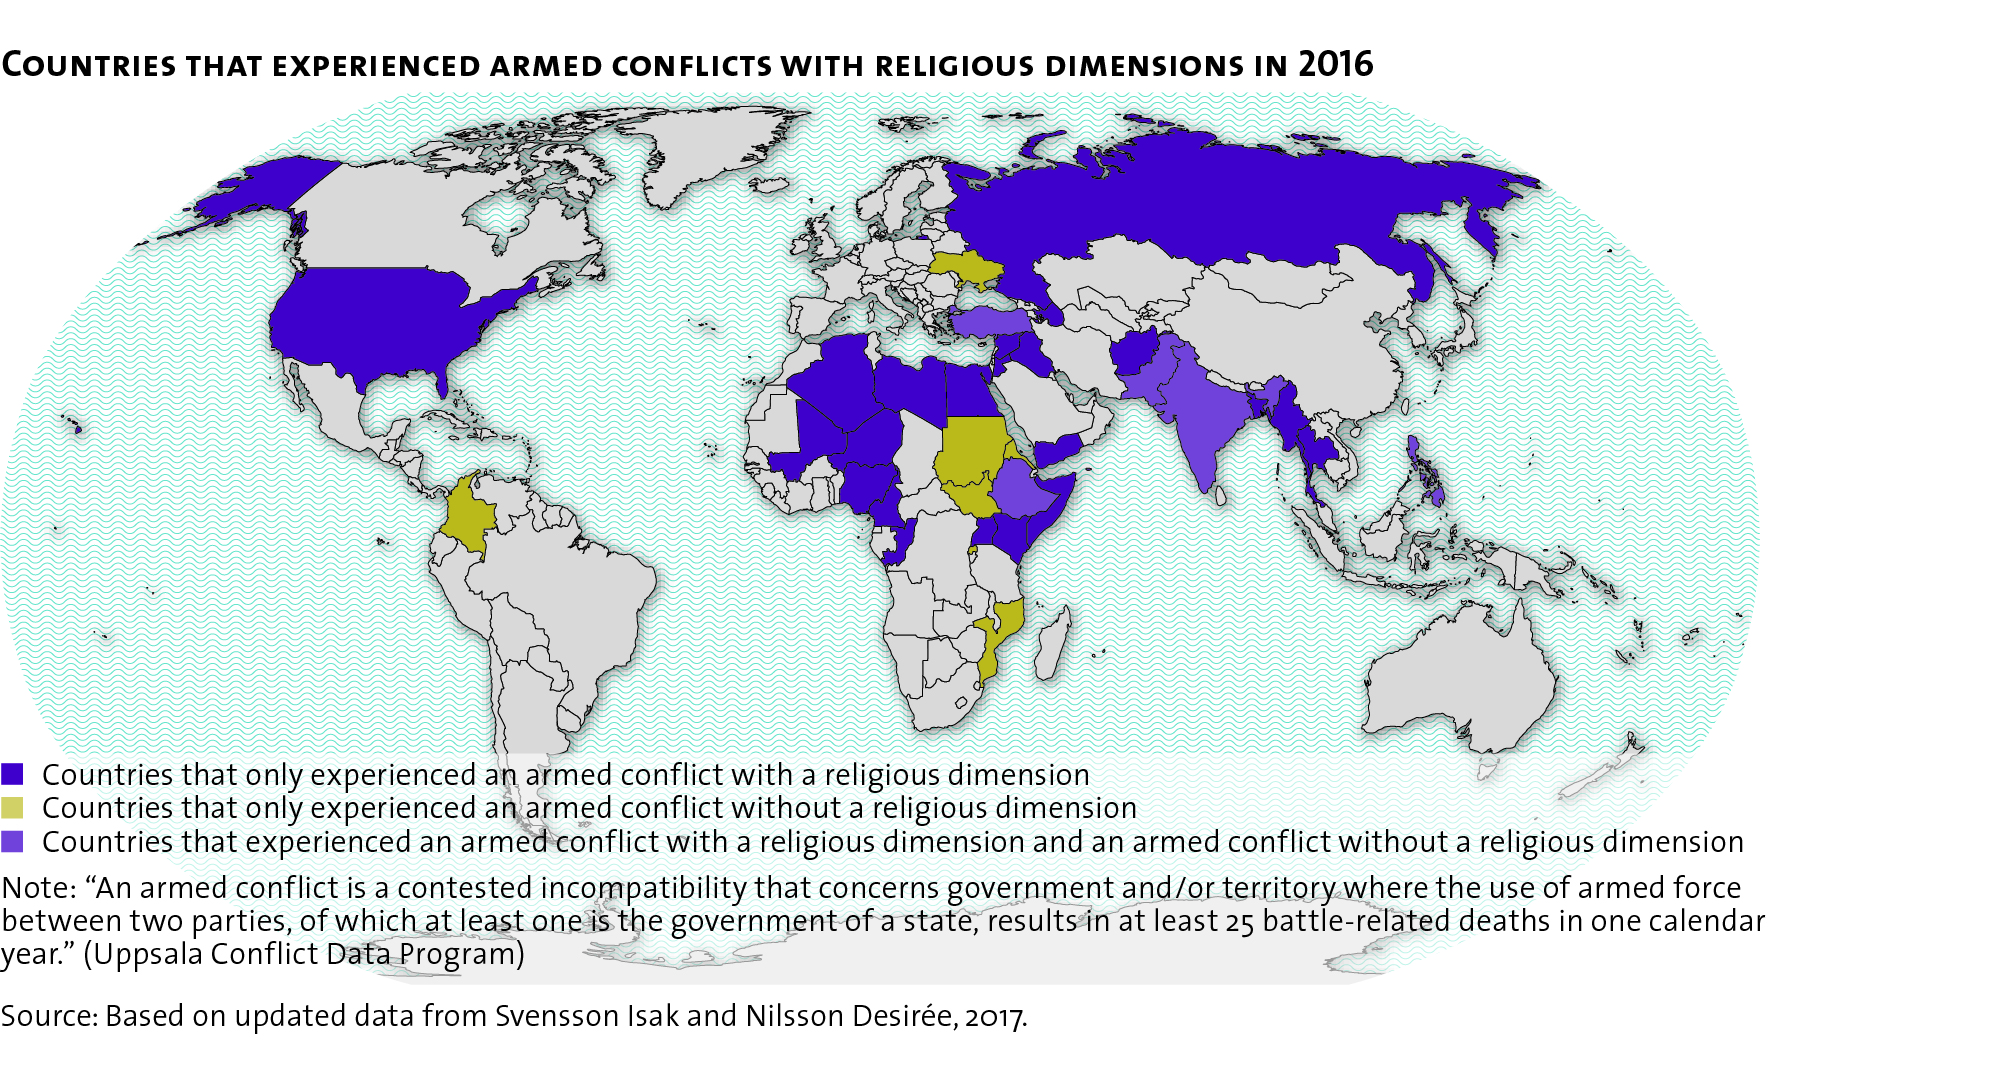
This graphic maps out the various countries that experienced armed conflicts with religious dimensions in 2016. To find out more about the interlinkages of religion and conflict and how conflict resolution approaches should respond, see Jonas Baumann, Daniel Finnbogason, and Isak Svensson’s CSS Policy Perspective here. For more graphics on conflict resolution, see the CSS’ collection of graphs and charts on the subject here.
