This graphic maps out a selection of Chinese AI companies and provides an overview of their current projects and collaborative efforts. To find out more about China’s ambitions to become a world leader in artificial intelligence, see Sophie-Charlotte Fischer’s recent addition to our CSS Analyses in Security Policy series here. For more graphics on economics, see the CSS’ collection of graphs and charts on the subject here.
the Center for Security Studies

This graphic of the week maps the 57 OSCE participating states and the organization’s 11 partner countries. To find out more about the OSCE, see Christian Nünlist’s CSS Analyses “The OSCE and the Future of European Security” and “The OSCE’s Military Pillar: The Swiss FSC Chairmanship“. For more CSS charts, maps and graphics on defense policy, click here.

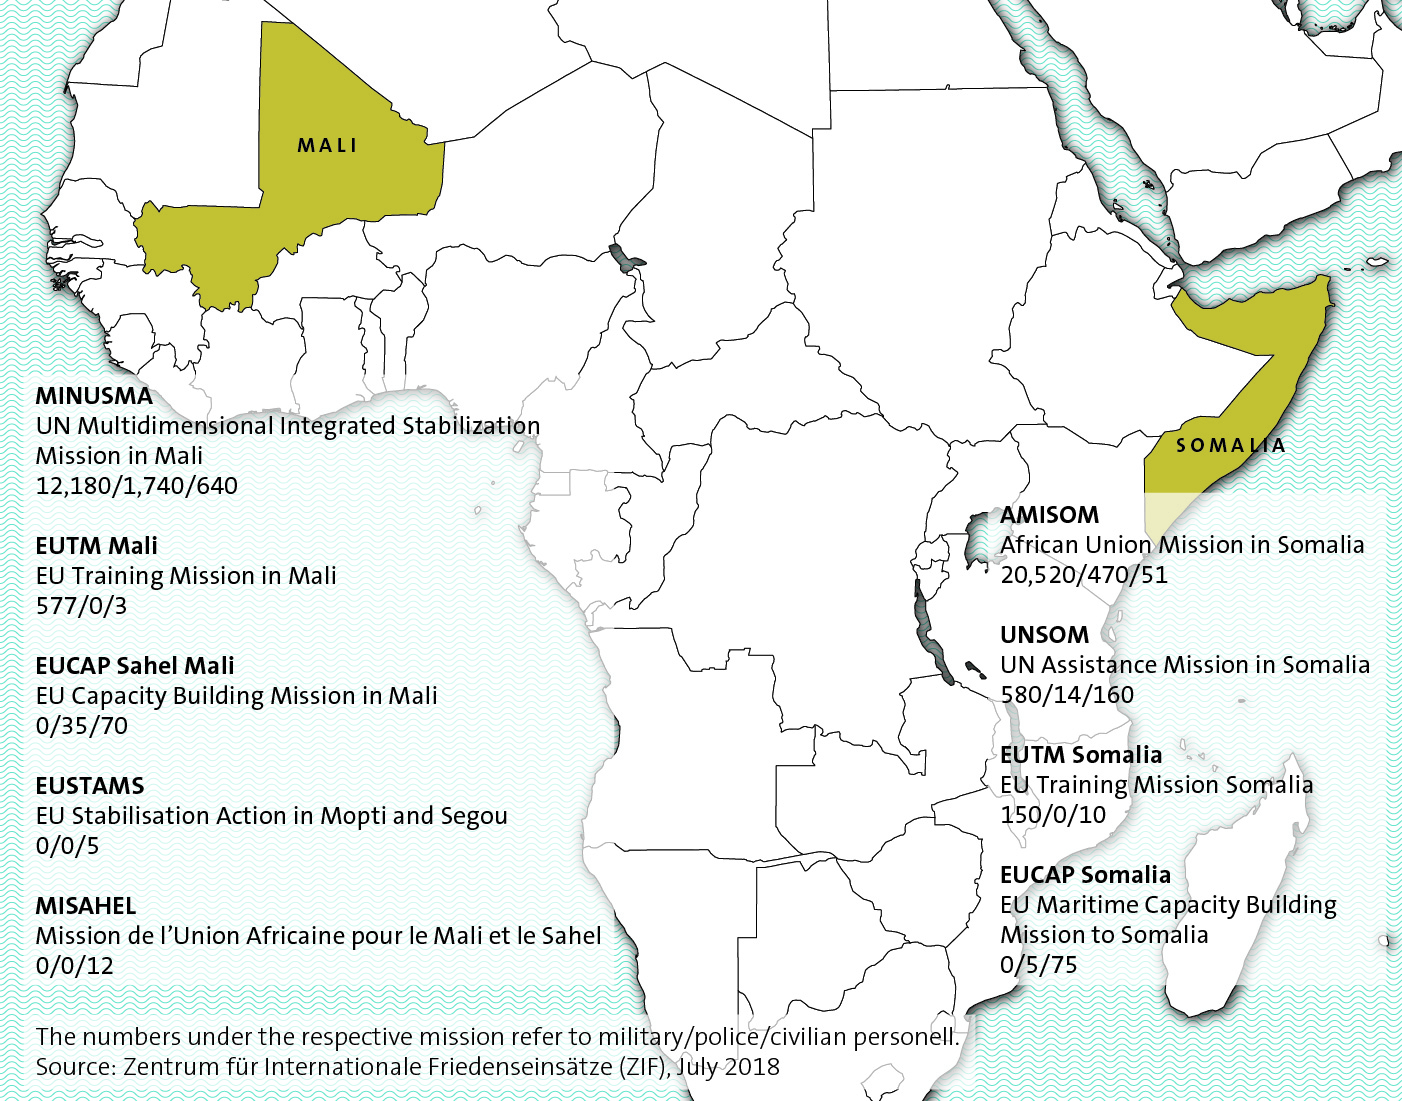
This graphic of the week lists the various international peacekeeping missions currently taking place in Mali and Somalia. To find out more about what political and operational challenges these peacekeeping missions face, see here. For more CSS charts, maps and graphics on defense policy, click here.

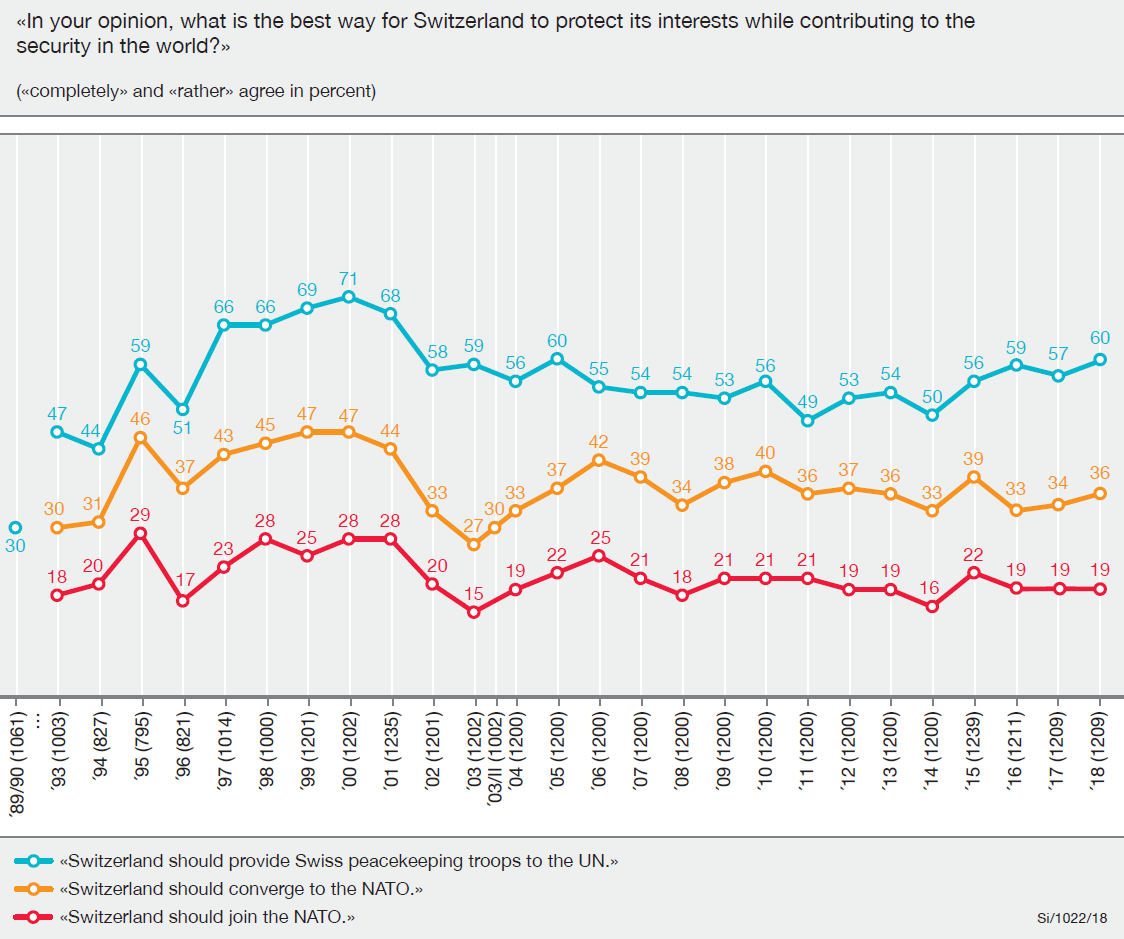
This graphic of the week tracks how the Swiss public’s attitude toward security alliances has developed over the past 30 years. To find out more about long-term trends and tendencies in Swiss public opinion on foreign, security, and defense policy issues, see here (in German). For more CSS charts, maps and graphics on defense policy, click here.
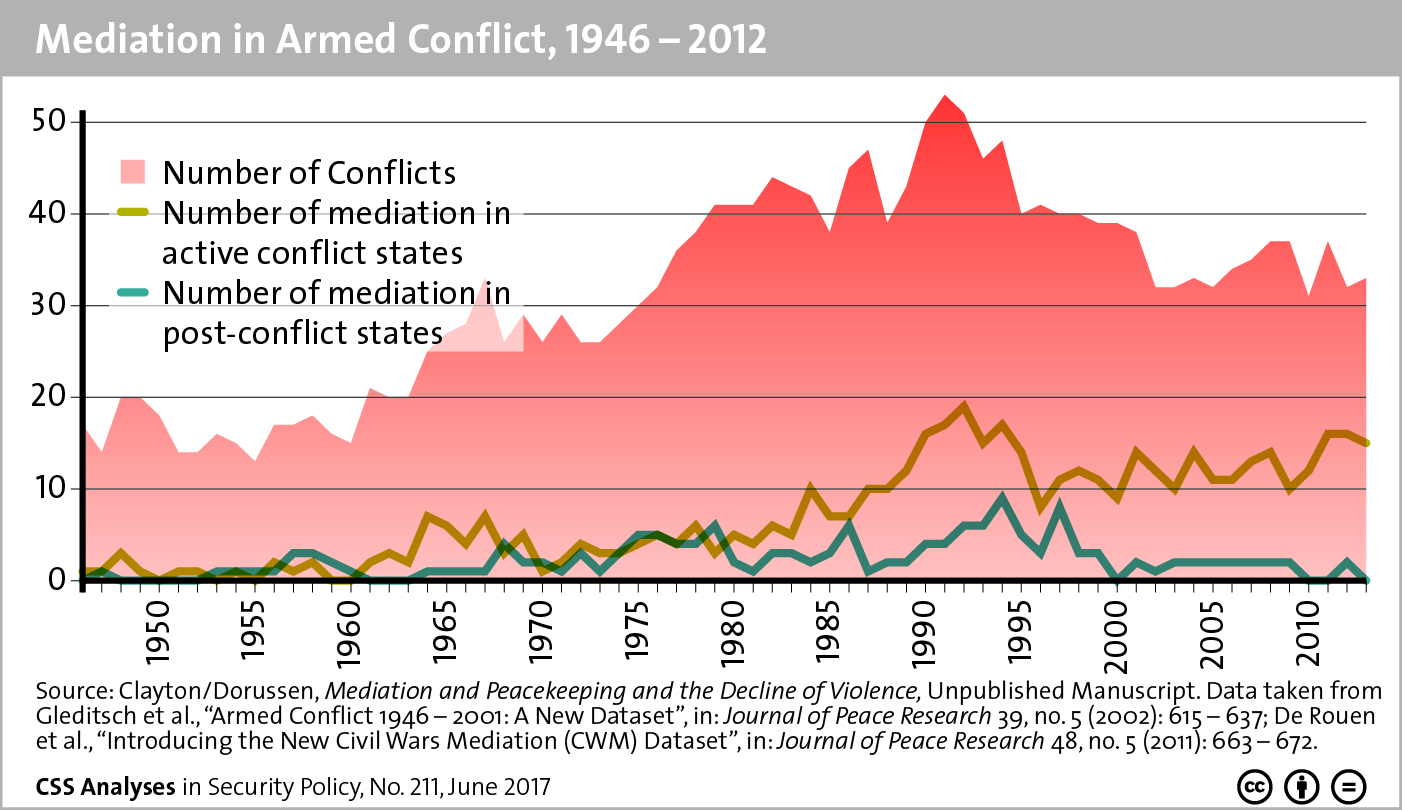
Mediation in Armed Conflict, 1946-2012

This graphic contrasts the number of conflicts that occurred between 1946 and 2012 with the amount of mediation that took place over the same period in both active-conflict and post-conflict states. To find out more about mediation in armed conflict, see Jonas Baumann and Govinda Clayton’s recent addition to our CSS Analyses in Security Policy series here. For more graphics on peace and conflict, see the CSS’ collection of graphs and charts on the subject here.


