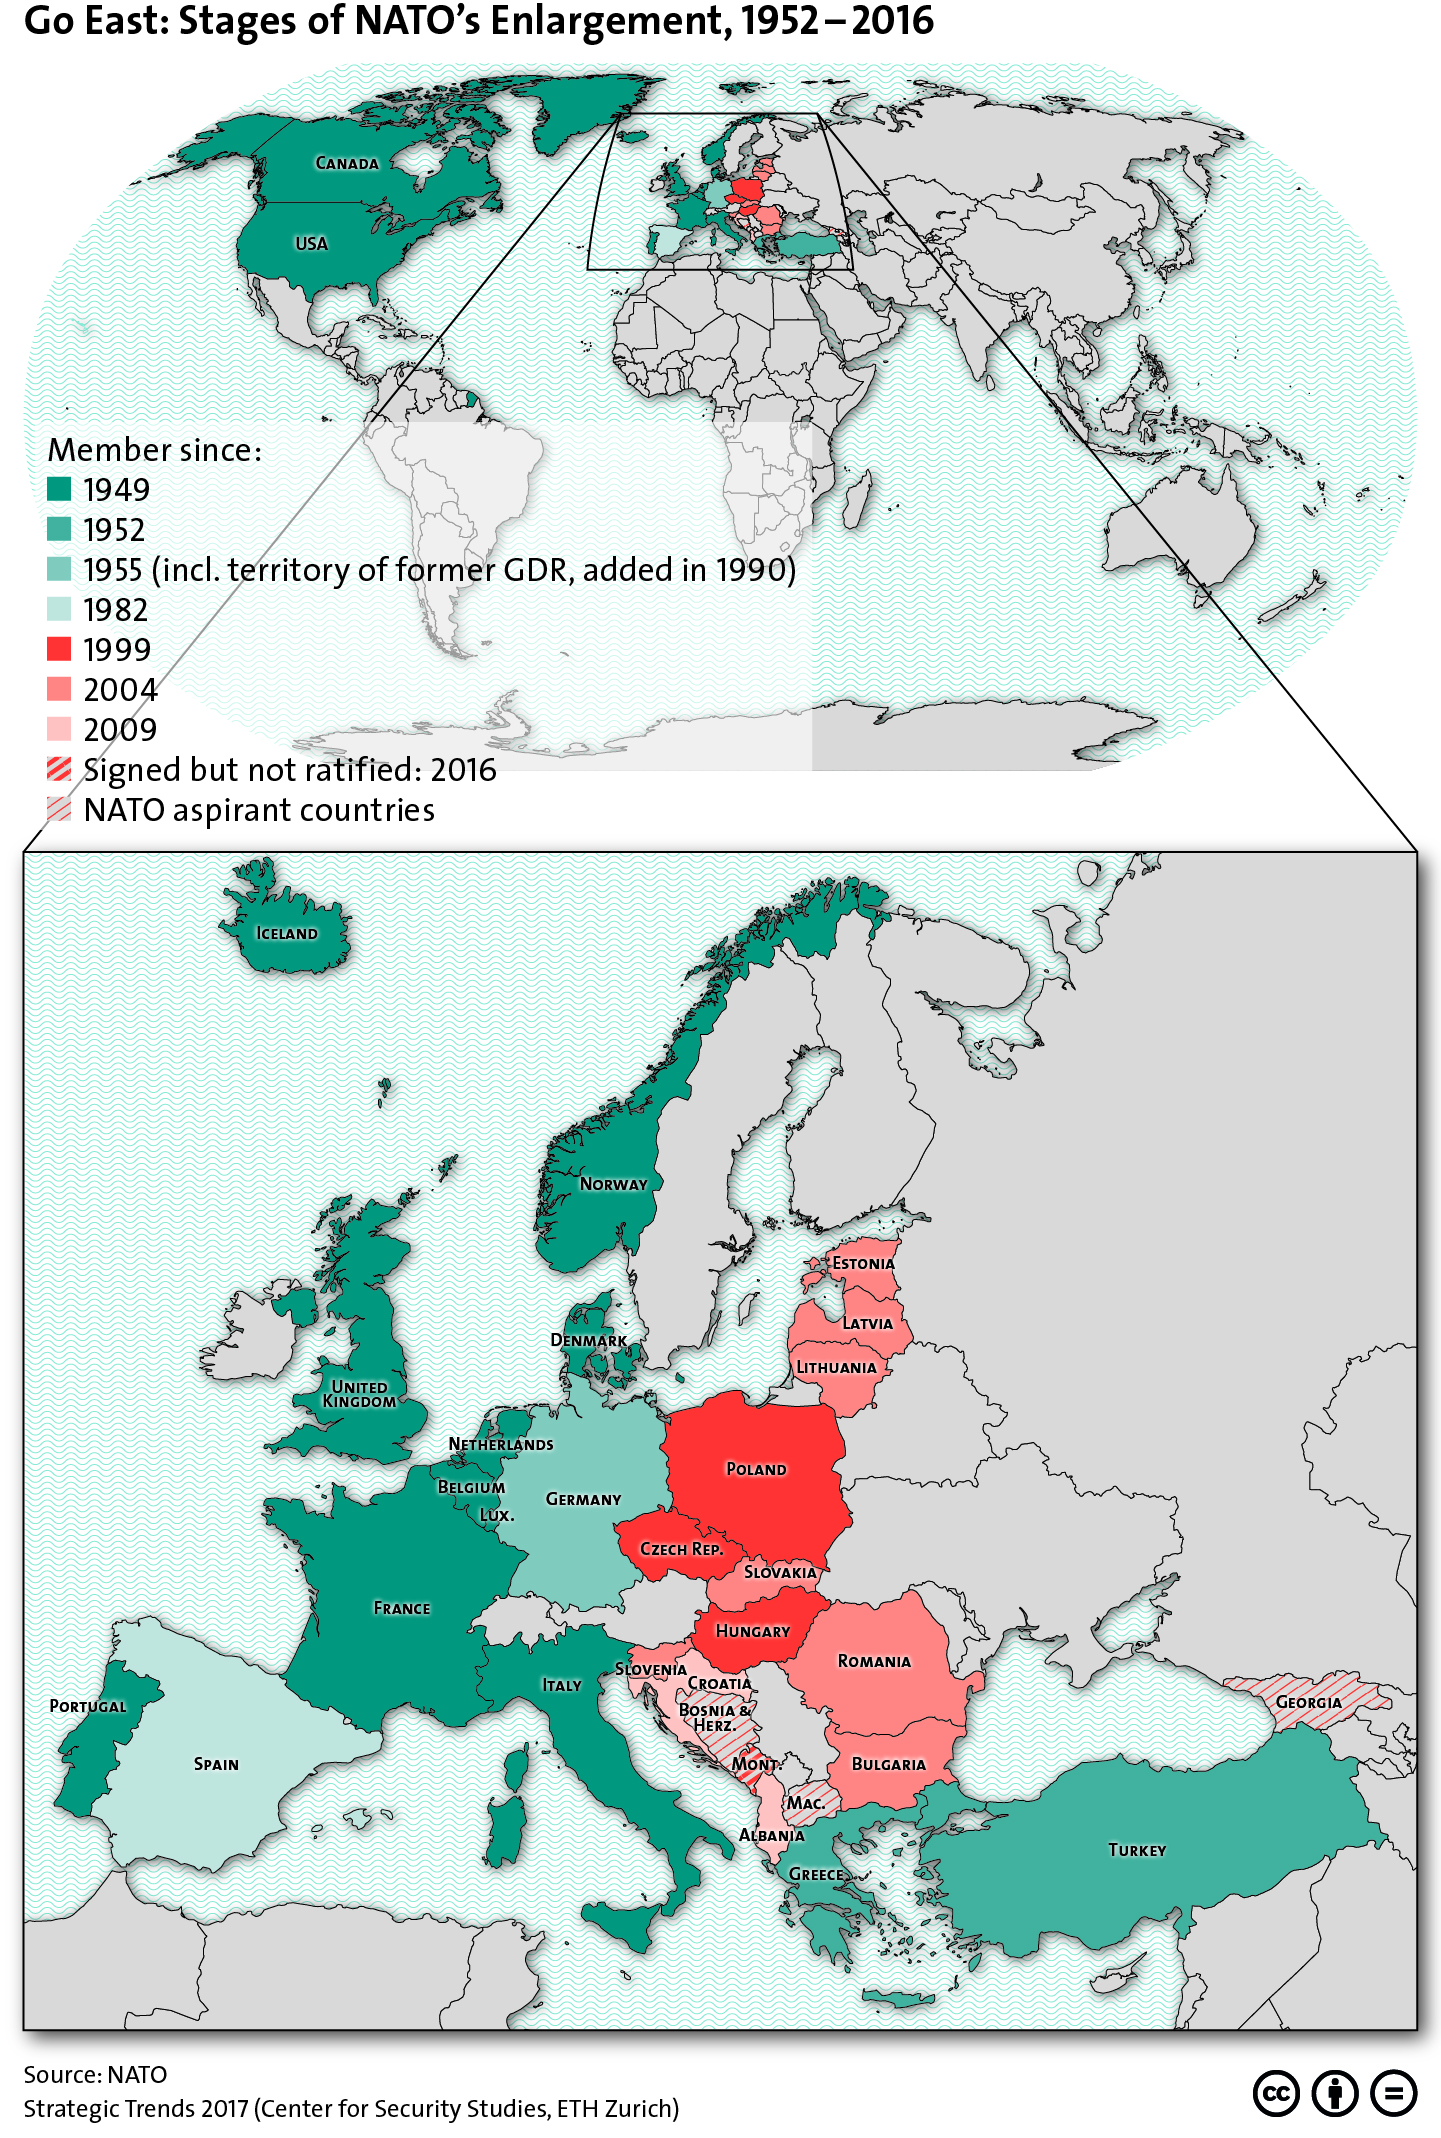
This graphic tracks the stages of NATO’s eastern enlargement since 1952. To find out more about Europe’s post-Cold War security architecture, see CSS’ Christian Nünlist’s chapter in Strategic Trends 2017 here. For more CSS charts, maps and graphics on economics, click here.
If Poland’s president gets his way, the Pentagon might soon start building Fort Trump on Polish soil. Permanently posting thousands of American troops in Poland, however, isn’t the best way to convince NATO allies that America will defend them from Russian aggression.
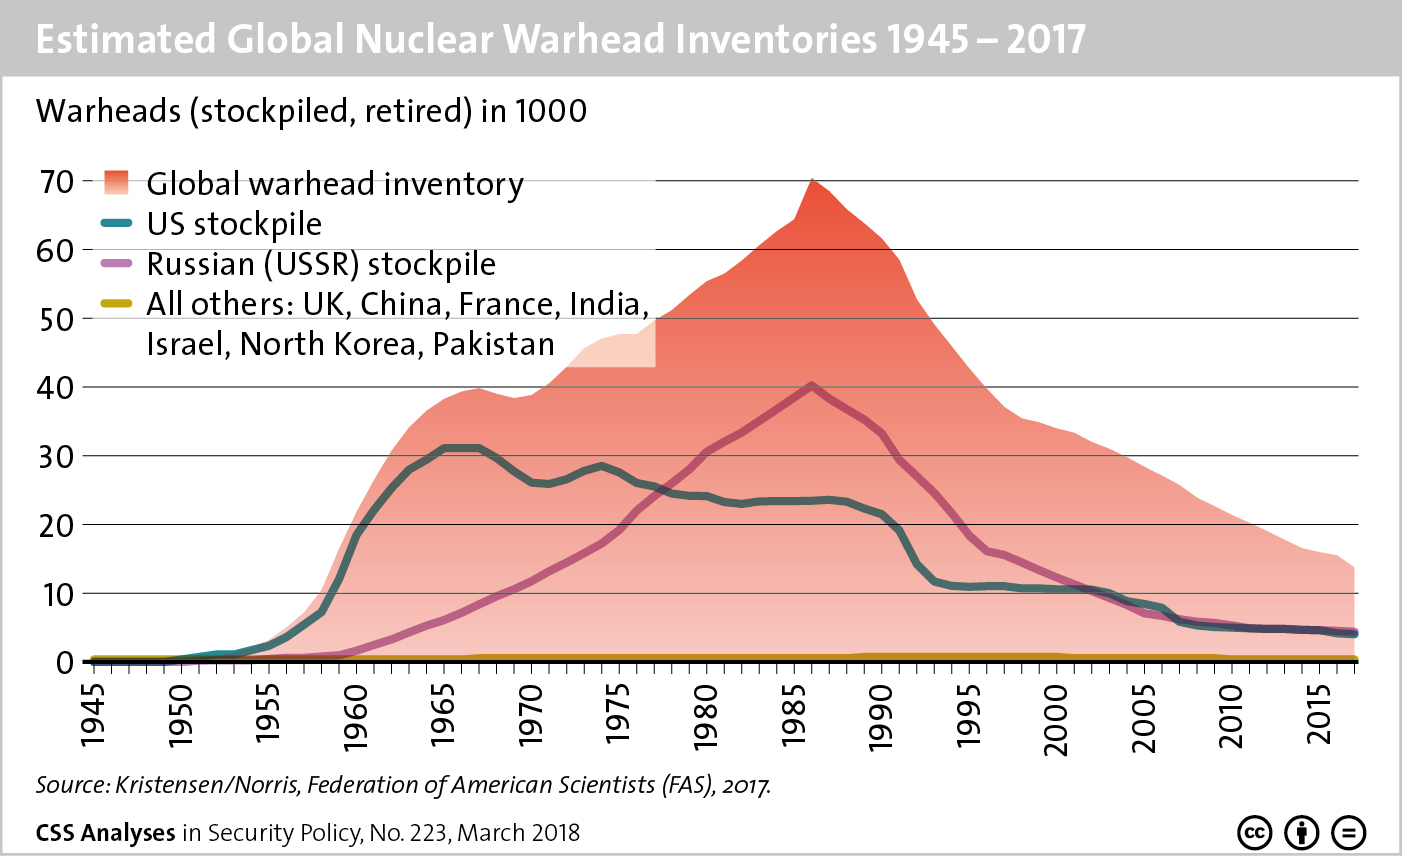
This graphic provides an overview of estimated global nuclear warhead inventories from 1945 to 2017. To find out more about the Trump administration’s ‘Nuclear Posture Review’ and what it means for US nuclear policy, see Oliver Thränert ‘s recent addition to the CSS’ Analyses in Security Policy series here. For more CSS charts and graphs on proliferation, click here.
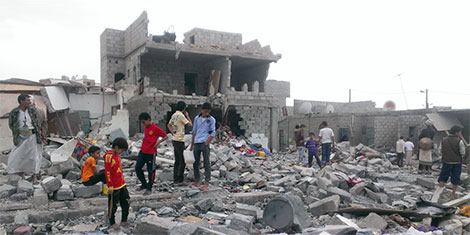
As with most civil wars, the war in Yemen is marked by the influence of outside actors. It began in September 2014, when the Iranian-backed Houthis took over the capital Sana’a, and it might well have ended six months later, when the president fled a Houthi advance on Aden. Instead, Saudi Arabia led a coalition of ten Arab countries—supported by the United States—in an air and ground campaign against the Houthis. Since then, the war has ground on, with a new dimension of fighting opening recently between southern secessionist militias—many of which receive support from the United Arab Emirates—and government forces backed by the Saudi coalition. Since taking office, the Trump administration has increased American air strikes in Yemen six fold.