Categories
CSS Blog

Mapping the Conflict in Mali

Email Facebook Twitter

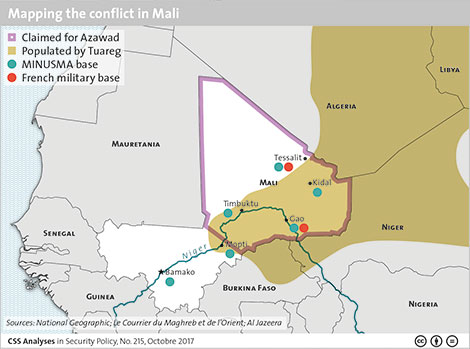
This graphic offers a geographical overview of the various international security actors in Mali’s ongoing struggle with widespread insecurity and Islamist extremism. To read more about the conflict as well as Switzerland’s efforts to support the Mali’s fragile peace, see Allison Chandler and Benno Zogg’s recent CSS analysis here. For more graphics on peace and conflict, check out the CSS’ collection of graphs and charts on the subject here.

Categories
CSS Blog

Oil Market 2012-2017

This graphic maps key indicators of the oil market in between 2012 – 2017. For more information on which trends will shape the oil market, check out this CSS analysis by Severin Fischer. For more graphics on natural resources, check out the CSS’ collection of graphs and charts on the subject here.

Categories
CSS Blog

WHO Decision Instrument for the Assessment of Events

This graphic maps the World Health Organization’s decision instrument for the assessment and notification of events that may constitute a public health emergency of international concern. For more on how the WHO’s international health regulations aim to contain outbreaks in the early stages, see Ursula Jasper’s recent CSS analysis here. For more graphics on international organizations, check out the CSS’ collection of graphs and charts on the subject here.

Categories
Disclaimer

A Note to Our Users:

Disclaimer

The views and opinions expressed on this page do not reflect those of the Center for Security Studies or the Swiss Federal Institute of Technology Zurich (ETH). In addition, neither organization is responsible for the content of external links.