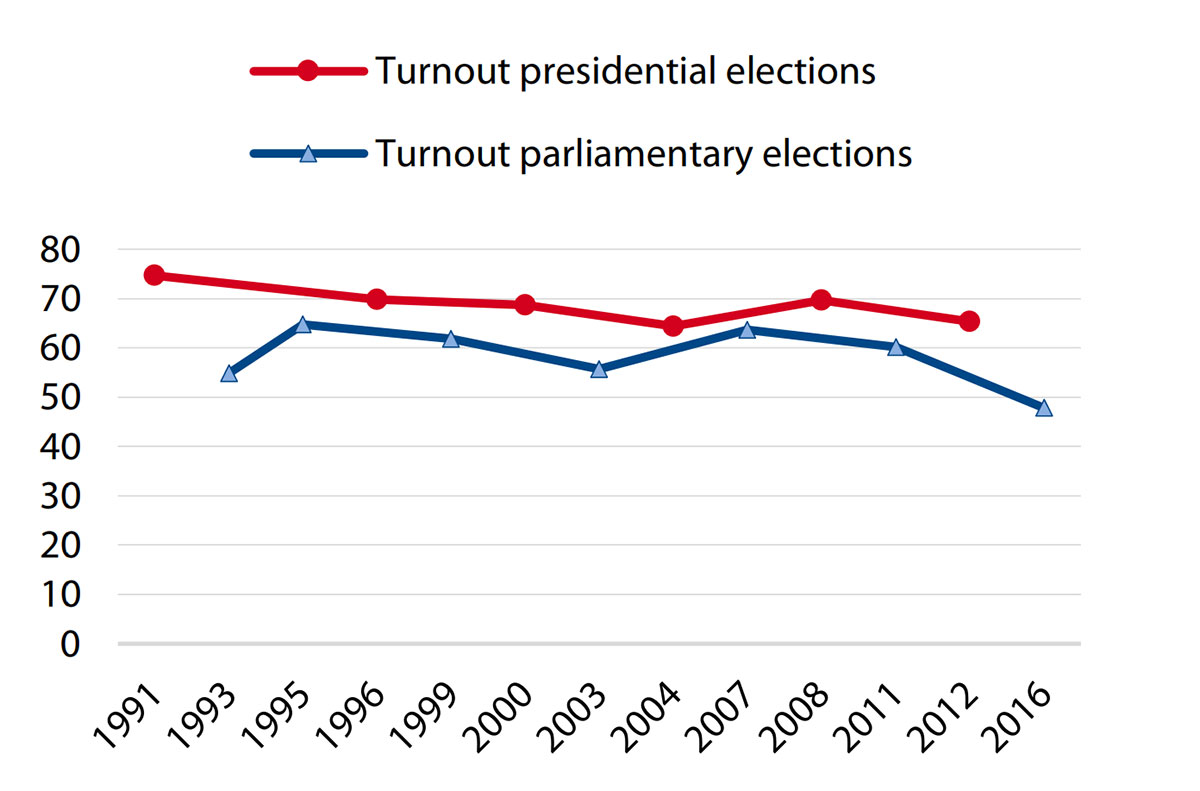
This graphic tracks overall voter turnout in Russian presidential and parliamentary elections from 1991 to 2016. To find out more about voter turnout trends and electoral mobilization in Russian federal elections, see Inga Saikkonen’s contribution to the latest edition of the Russian Analytical Digest here. To check out the CSS’ full collection of graphs and charts, click here.

the Center for Security Studies
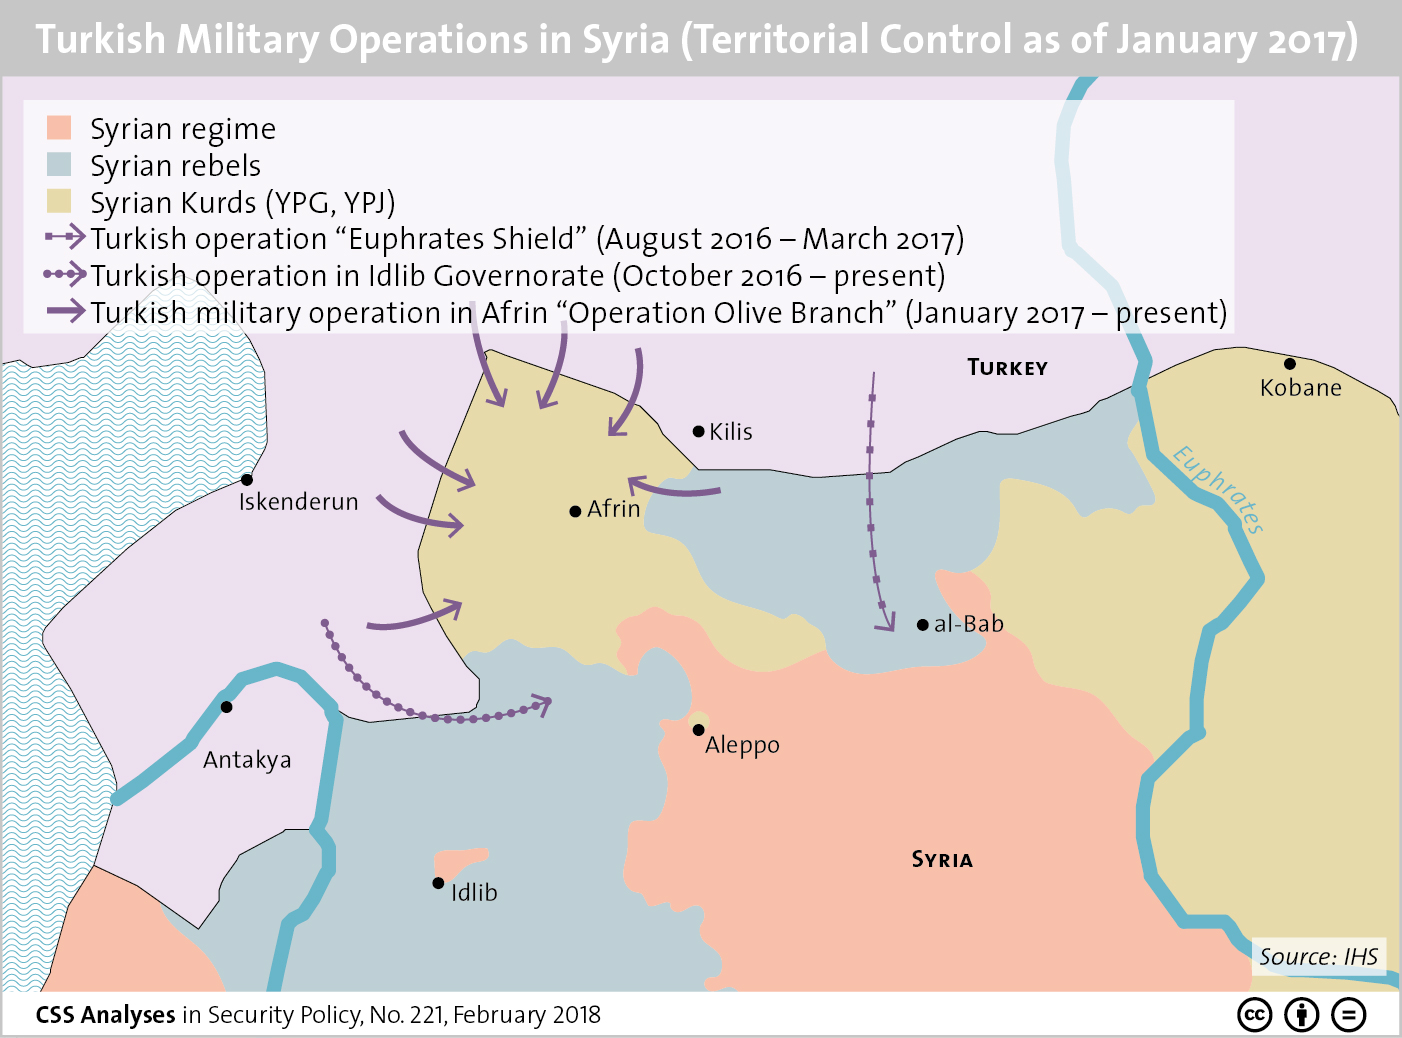
This graphic maps Turkish military operations taking place in Syria between 2016 and 2018. To find out more about Turkey’s security situation and its military operations in Syria, see Fabien Merz’s recent addition to our CSS Analyses in Security Policy series here. For more graphics on defense policy, see the CSS’ collection of graphs and charts on the subject here.
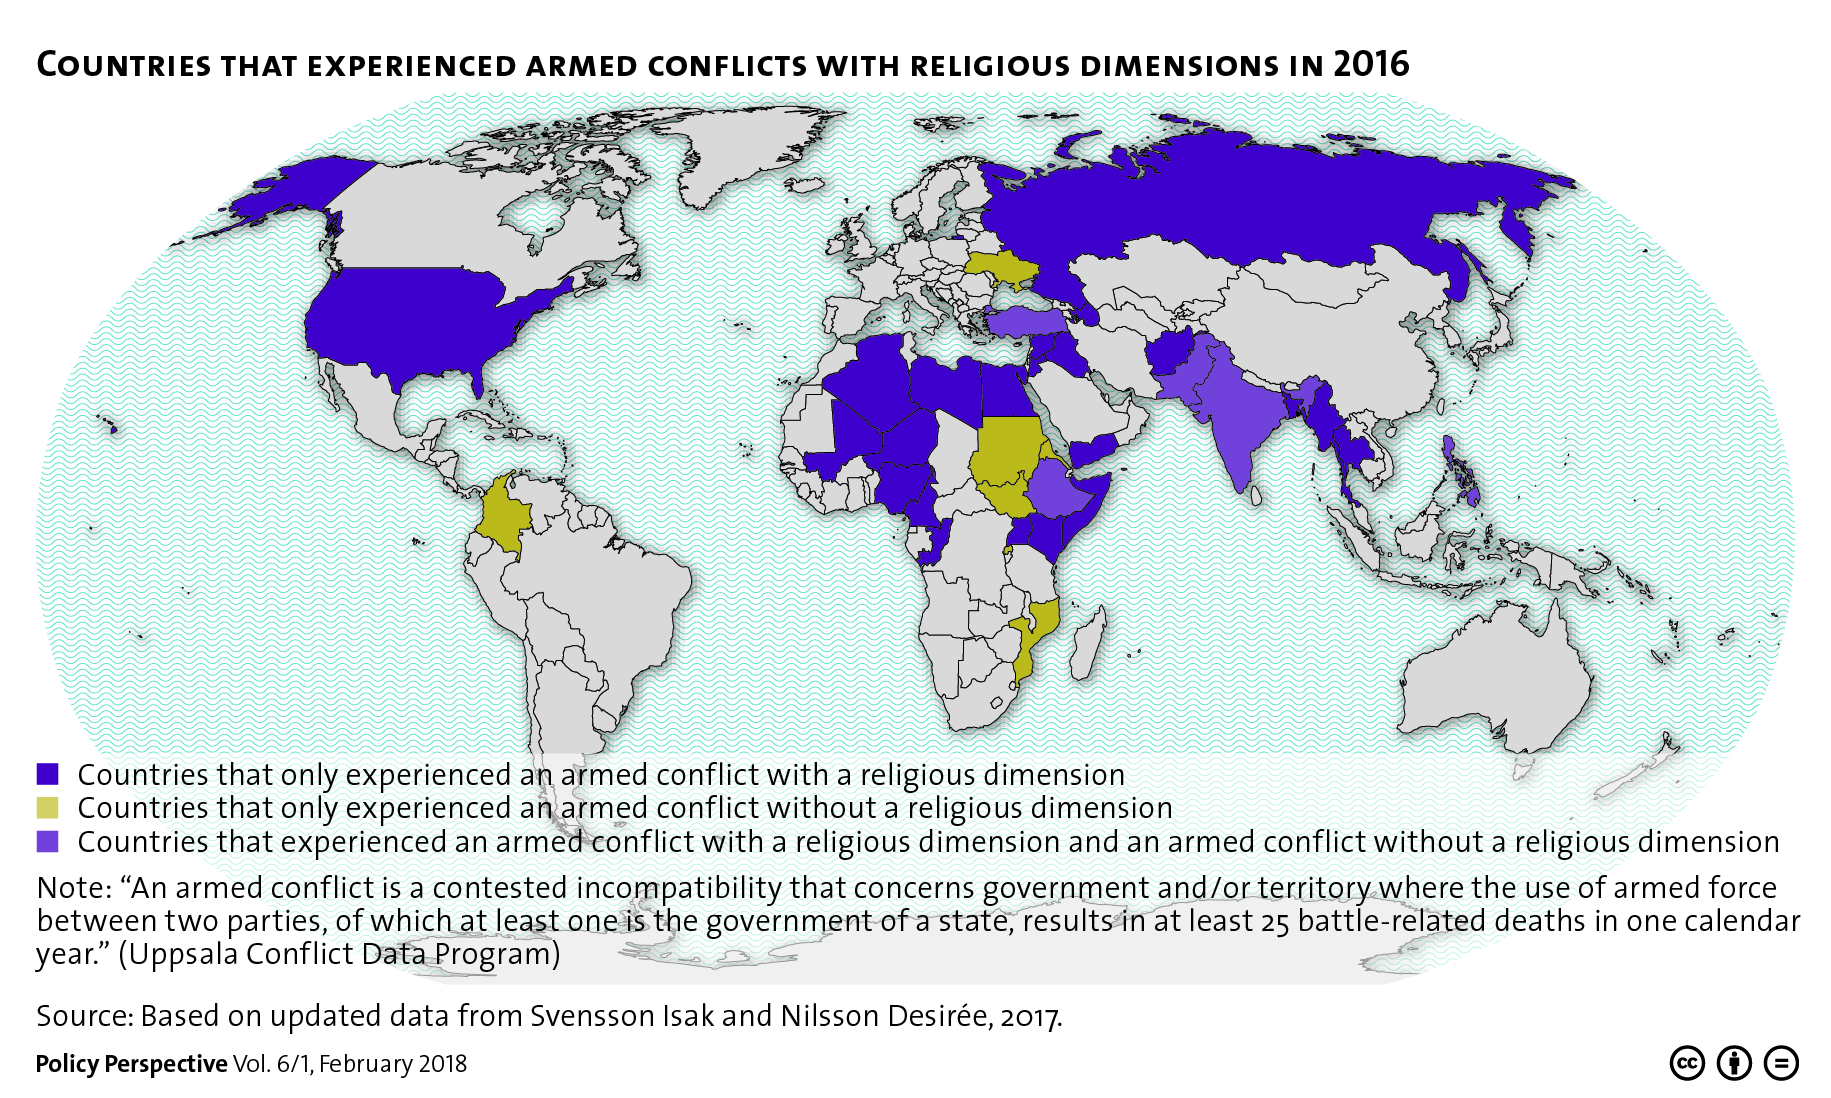
This graphic maps out the various countries that experienced armed conflicts with religious dimensions in 2016. To find out more about the role of religion in armed conflict, check out Jonas Baumann, Daniel Finnbogason and Isak Svensson’s newest addition to our CSS Policy Perspectives here. For more graphics on peace and conflict, check out the CSS’ collection of graphs and charts on the subject here.
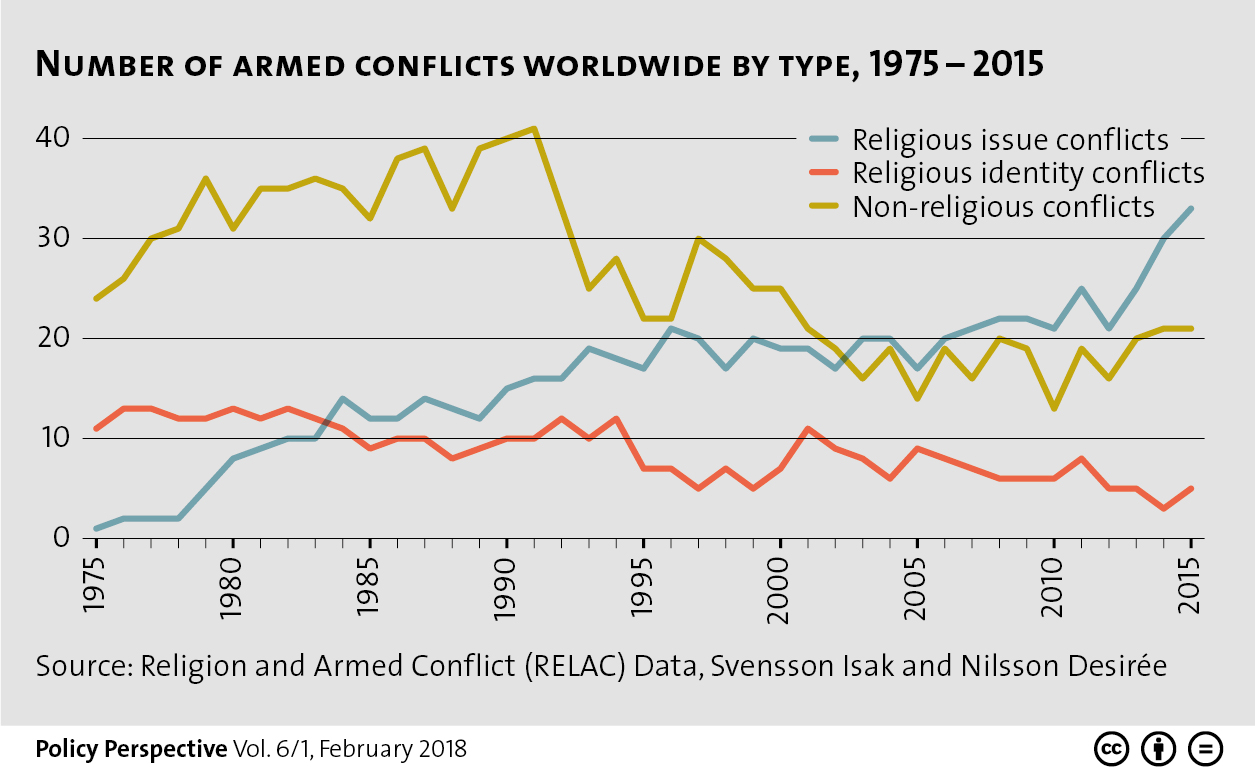
This graphic presents a breakdown of different types of armed conflict occurring worldwide from 1975-2015. To find out more about the role of religion in armed conflict, check out Jonas Baumann, Daniel Finnbogason and Isak Svensson’s newest addition to our CSS Policy Perspectives here. For more graphics on peace and conflict, check out the CSS’ collection of graphs and charts on the subject here.