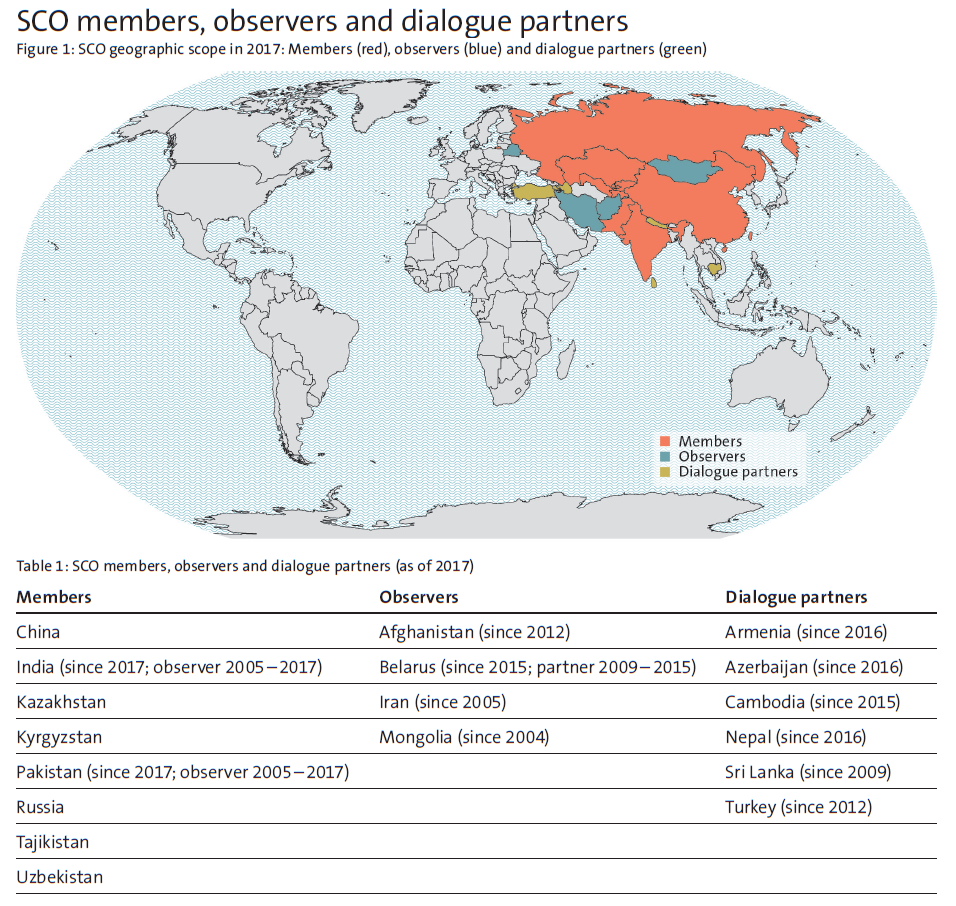
This graphic provides an overview of the Shanghai Cooperation Organisation’s (SCO) members, observers and dialogue partners. For more on the SCO, including how Europe and Switzerland could engage with the organization, see Linda Maduz’s new comprehensive study Flexibility by Design. For more CSS charts, maps and graphics, click here. Click image to enlarge.
the Center for Security Studies
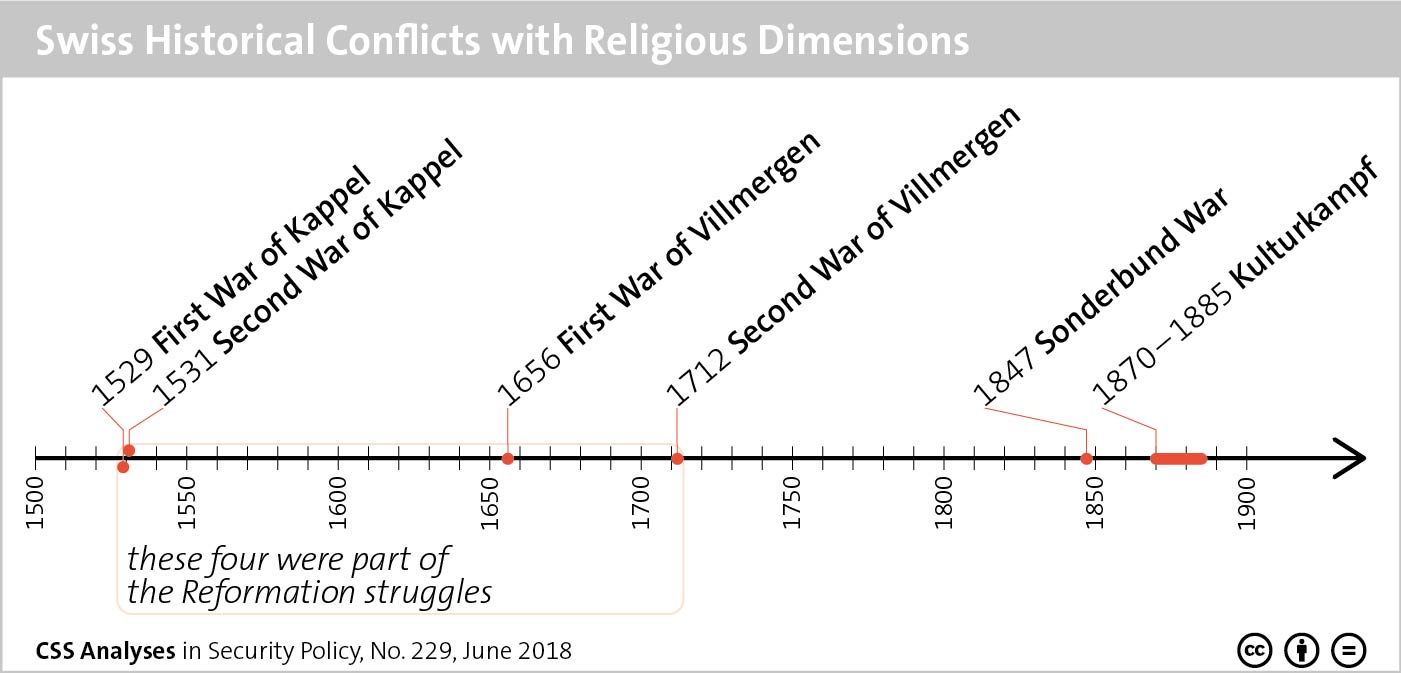
This graphic provides an overview of Swiss conflicts with religious dimensions since 1500. To find out how these conflicts continue to shape Switzerland’s contemporary political culture, see Jean-Nicolas Bitter and Angela Ullmann’s recent CSS Analyses in Security Policy here. For more CSS charts, maps and graphics, click here.
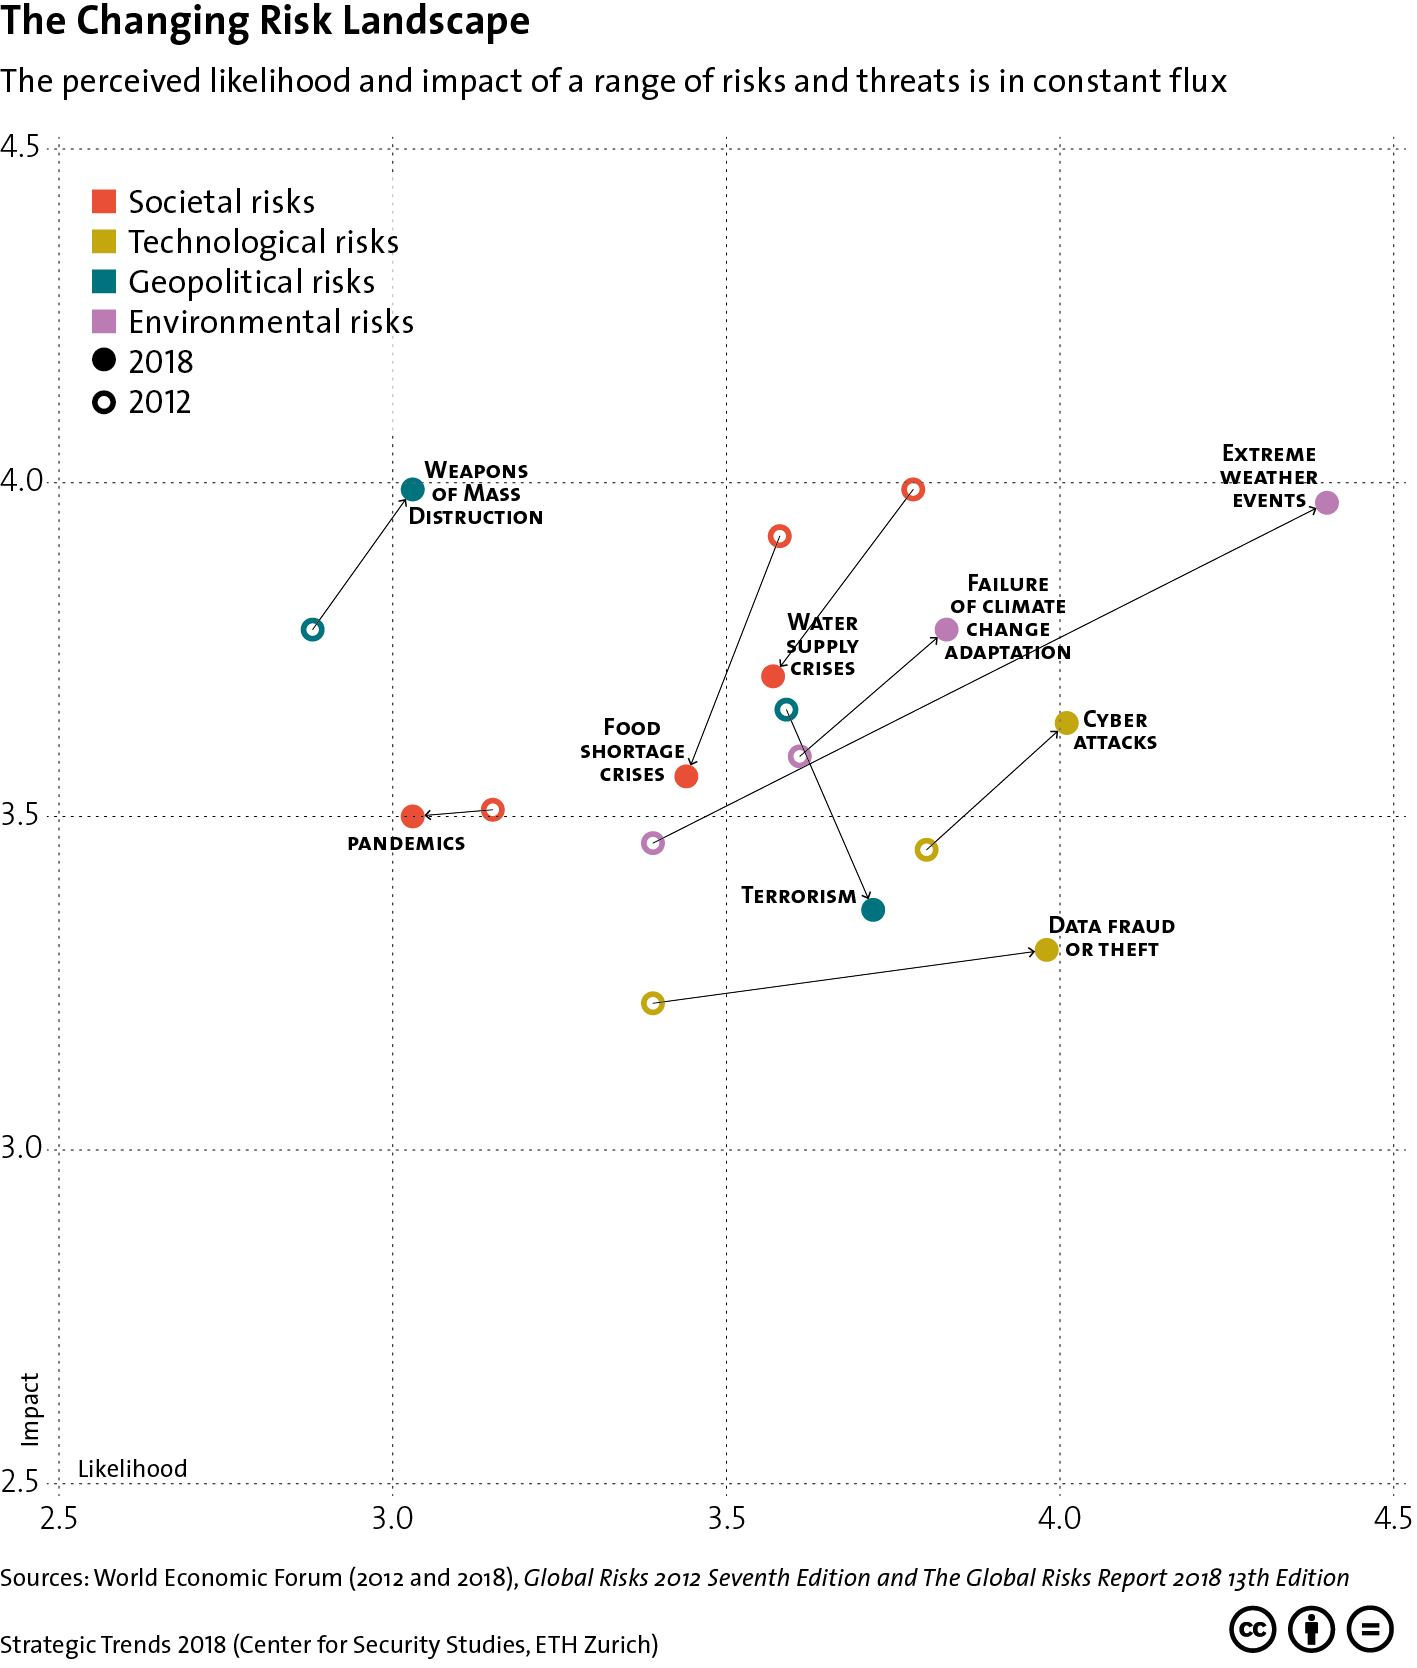
This graphic plots the change in the perceived likelihood and impact of various societal, technological, geopolitical and environmental risks between 2012 and 2018. For more on resilience and the evolution of deterrence, see Tim Prior’s chapter for Strategic Trends 2018 here. For more CSS charts, maps and graphics on risk and resilience, click here.
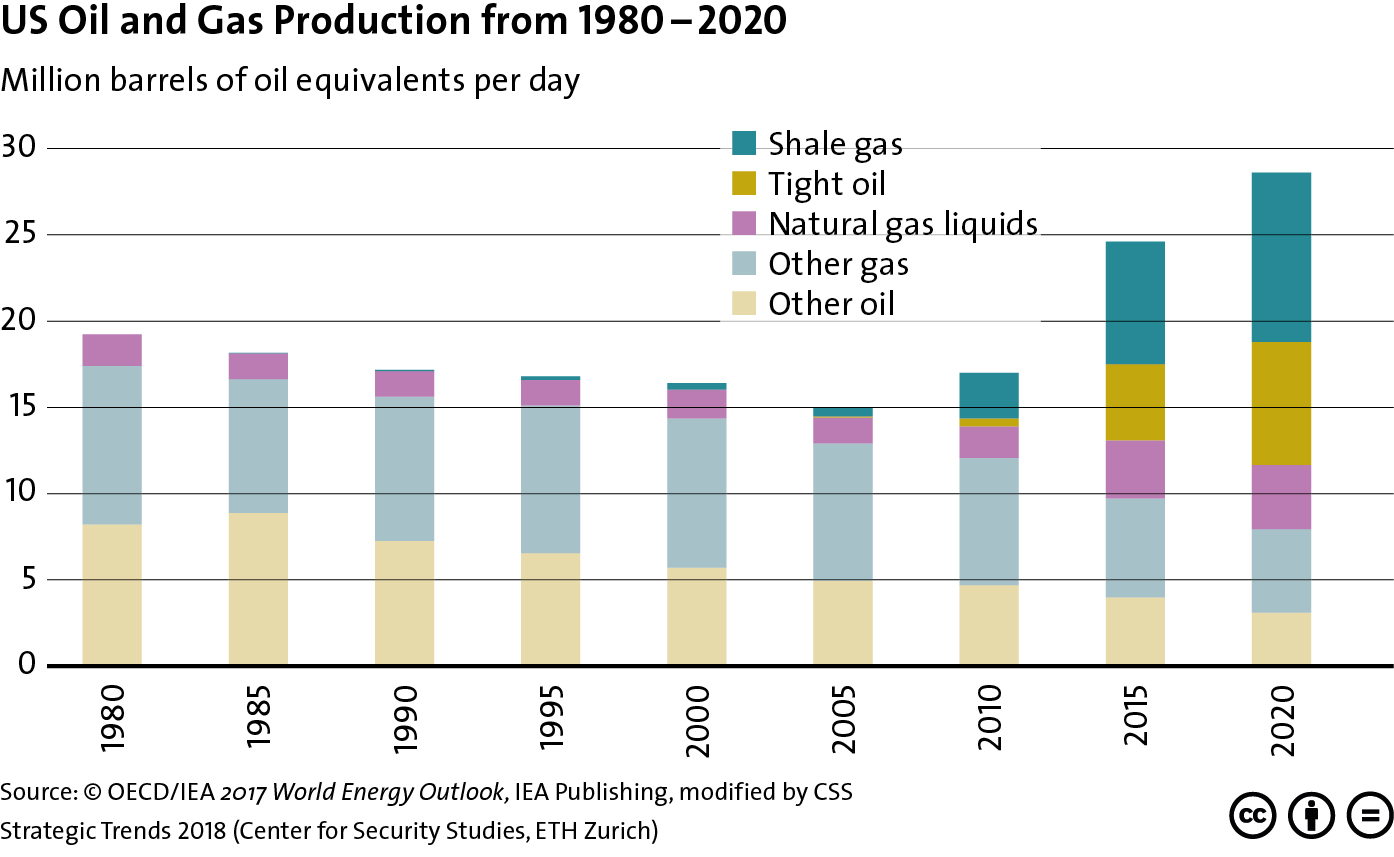
This graphic charts US oil and gas production from 1980 to 2015 and forecasts production up to 2020. For more on the interplay between technological innovation and the geopolitics of energy, see Severin Fischer ‘s chapter for Strategic Trends 2018 here. For more CSS charts, maps and graphics on natural resources, click here.
Complex Adaptive Systems
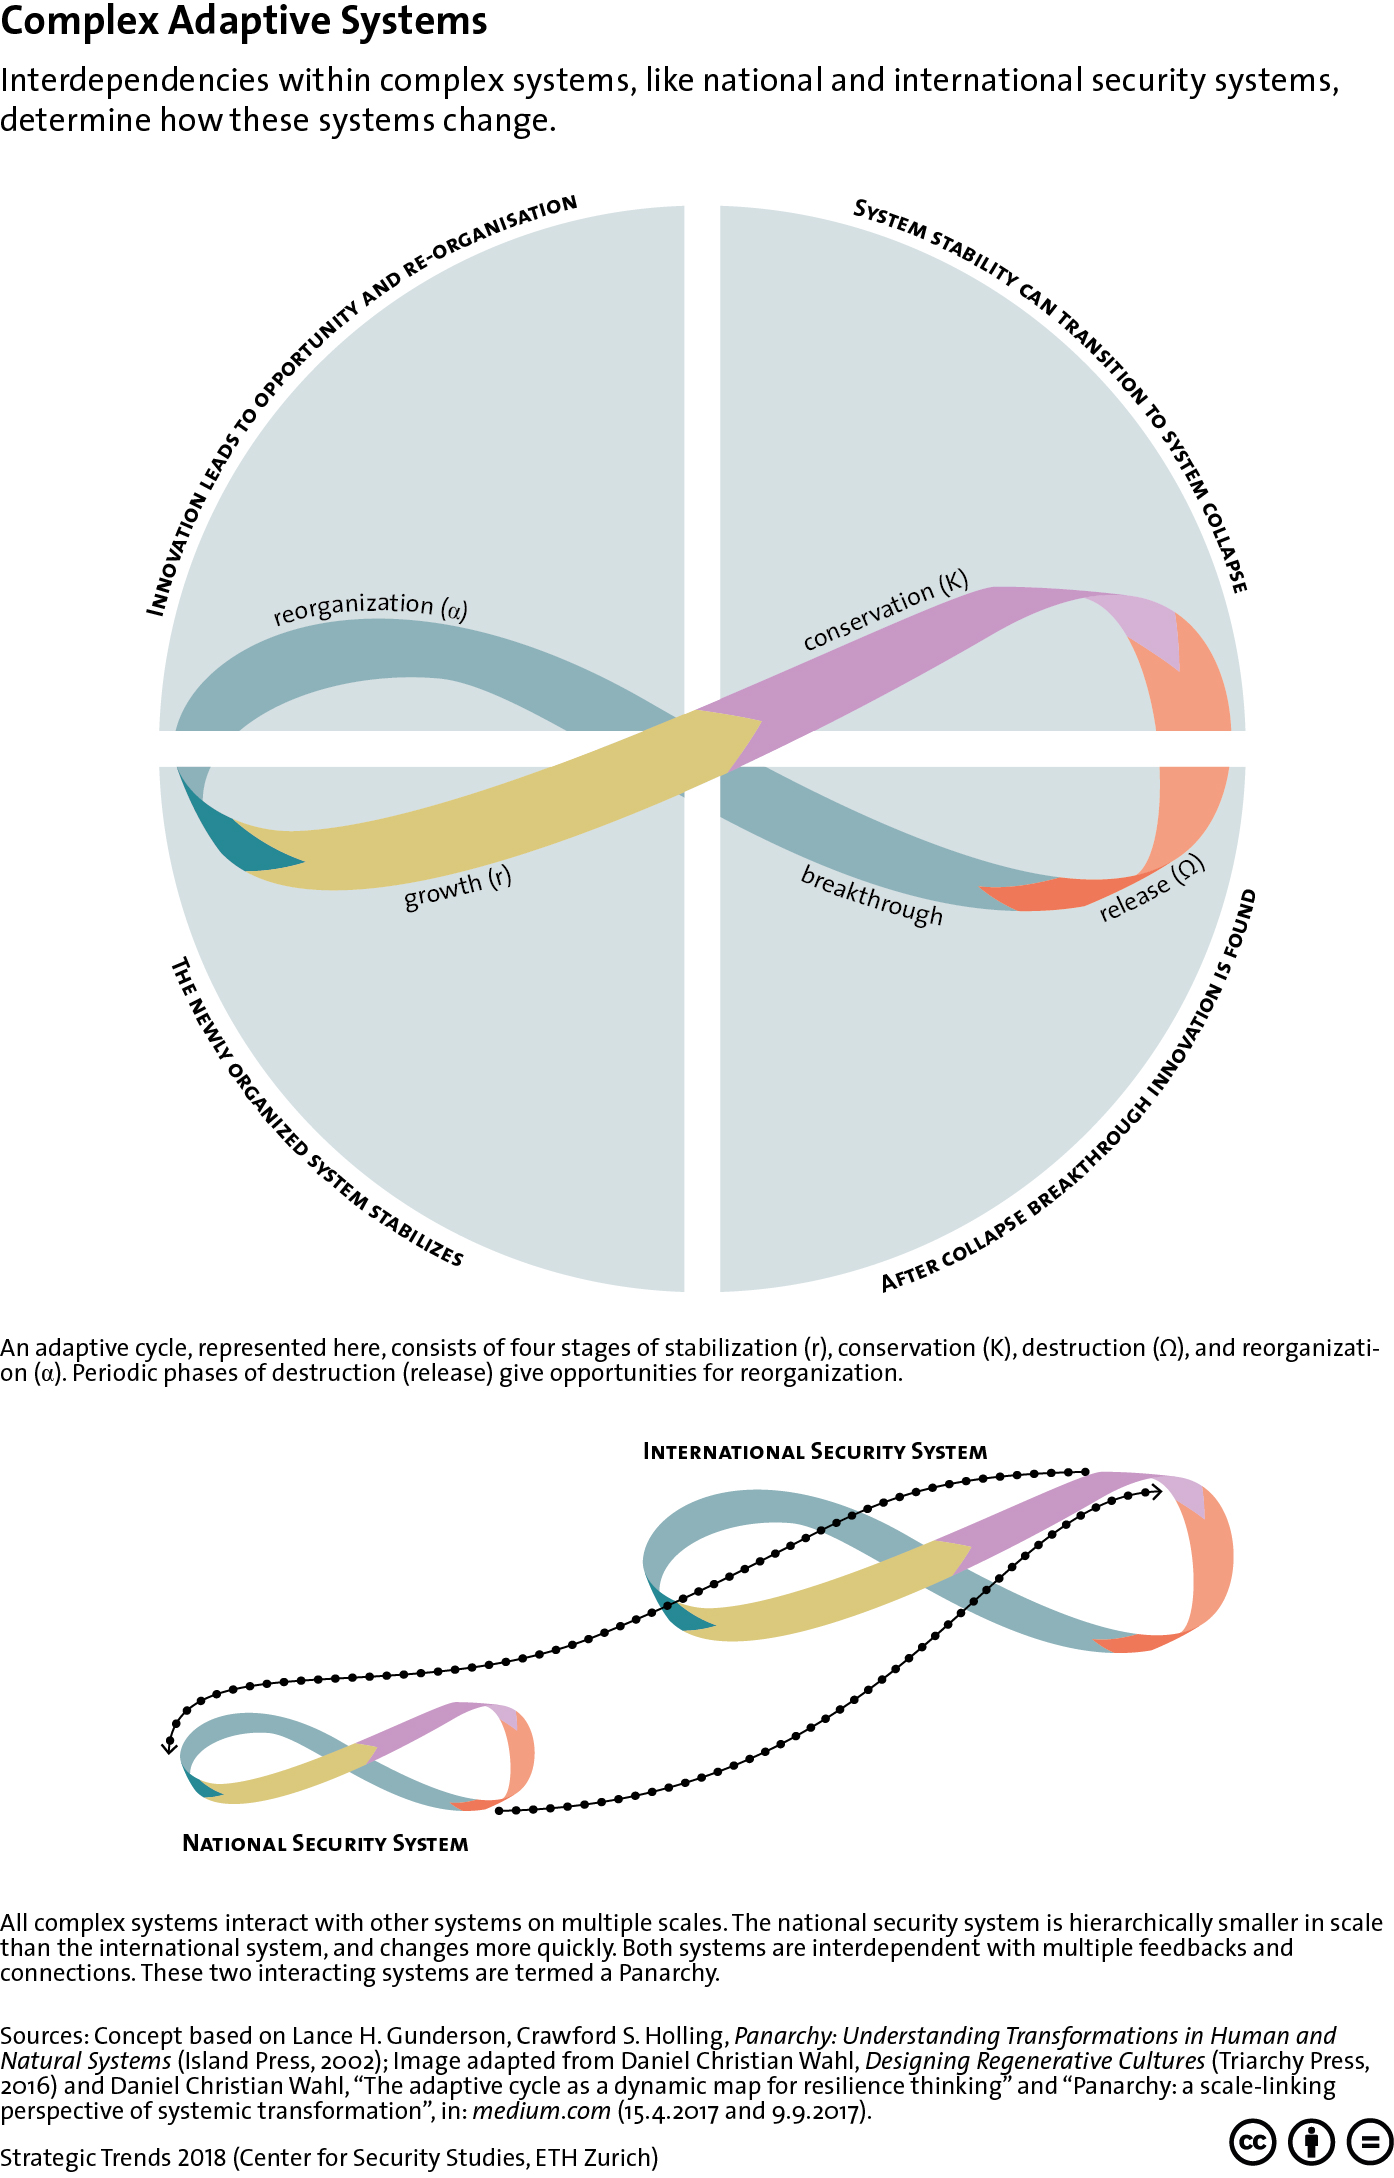
This graphic depicts 1) the adaptive cycles that take place within complex systems, such as national and international security systems; and 2) how national security systems interact with international security systems. For more on this subject as well as the concept of resilience, see Tim Prior’s chapter for Strategic Trends 2018 here. For more CSS charts, maps and graphics click here.
