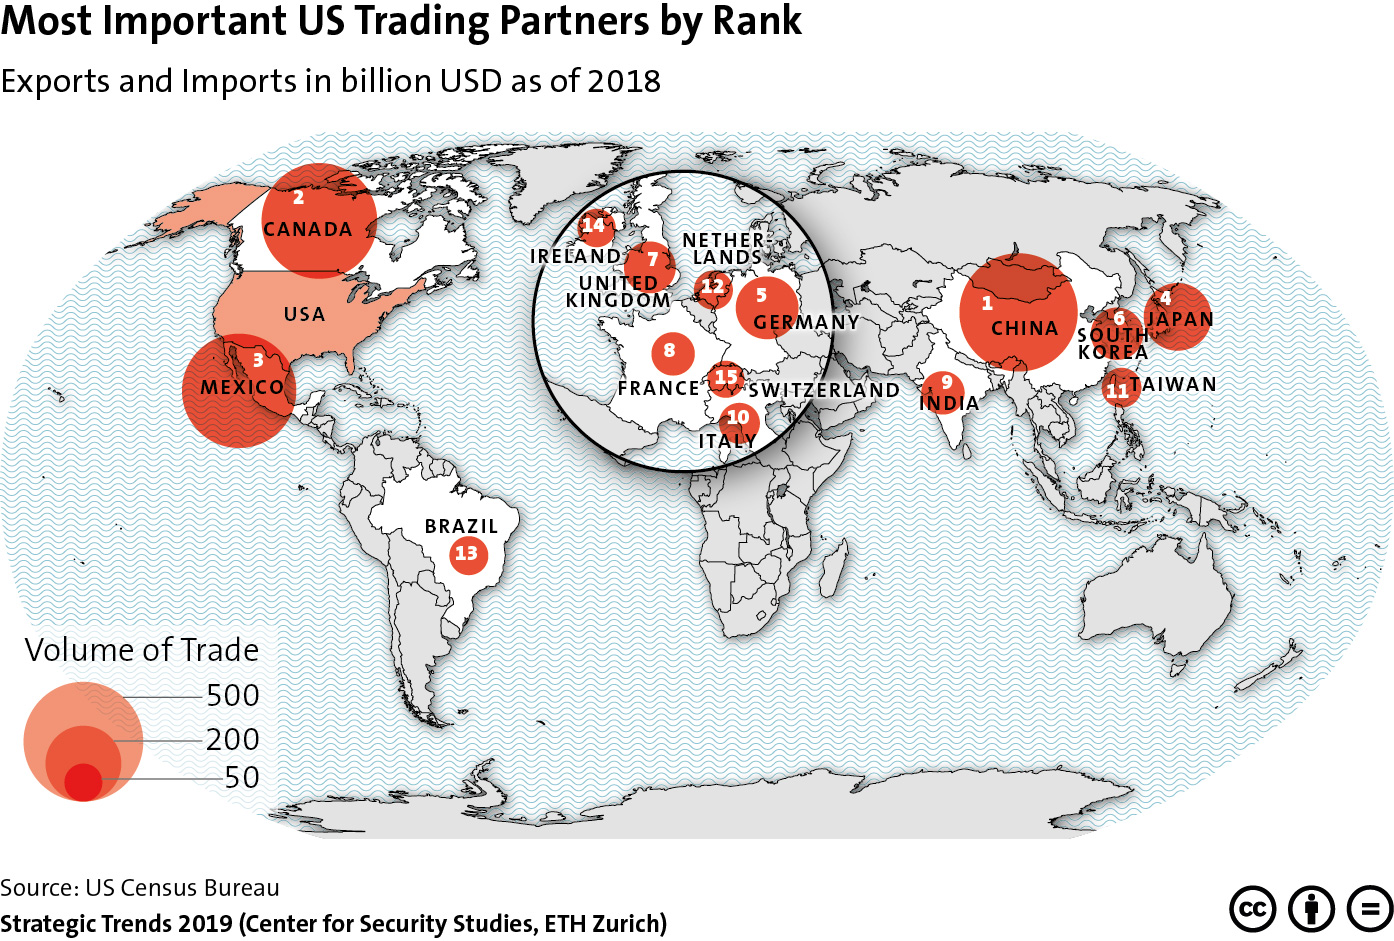
This graphic maps and ranks the US’ most important trading partners by trade volume. For an analysis of how this ranking is reflected in the Trump administration’s approach to trade policy, read Jack Thompson’s new Strategic Trends 2019 chapter here. For more CSS charts, maps and graphics on economics, click here.
Week: CSS Graphics
Graphics from the CSS
This graphic outlines the US national defense and international affairs budget from 1990-2019. To find out more, click here to read Jack Thompson’s Strategic Trends 2018 chapter on how the US is struggling to manage external challenges as well as domestic constraints, such as the underfunding and mismanagement of the military and diplomatic corps. For more CSS charts, maps and graphics on defense policy, click here.
This graphic maps current and proposed Russian gas pipeline projects in the country’s East, including the ‘Power of Siberia’ pipeline which traverses the Russian-Chinese border. For more on the Sino-Russia relationship, see Brian Carlson’s chapter for Strategic Trends 2018 here. For more CSS charts, maps and graphics on natural resources, click here.
This graphic features the different groups in NATO’s Framework Nations Concept (FNC) to highlight the trend of regionalization within NATO. But what does the FNC, with its emphasis on national sovereignty, actually mean for defense cooperation? See Rainer L Glatz and Martin Zapfe’s CSS Analysis in Security Policy here. For more CSS charts and graphics, click here.
From Cooperation to Confrontation
This graphic tracks how American opinions of Russia and Russian opinions of the United States have developed over time. To find out more about how these developments influenced Europe’s post-Cold War security architecture, see Christian Nünlist’s chapter in Strategic Trends 2017 here. For more CSS charts, maps and graphics, click here.