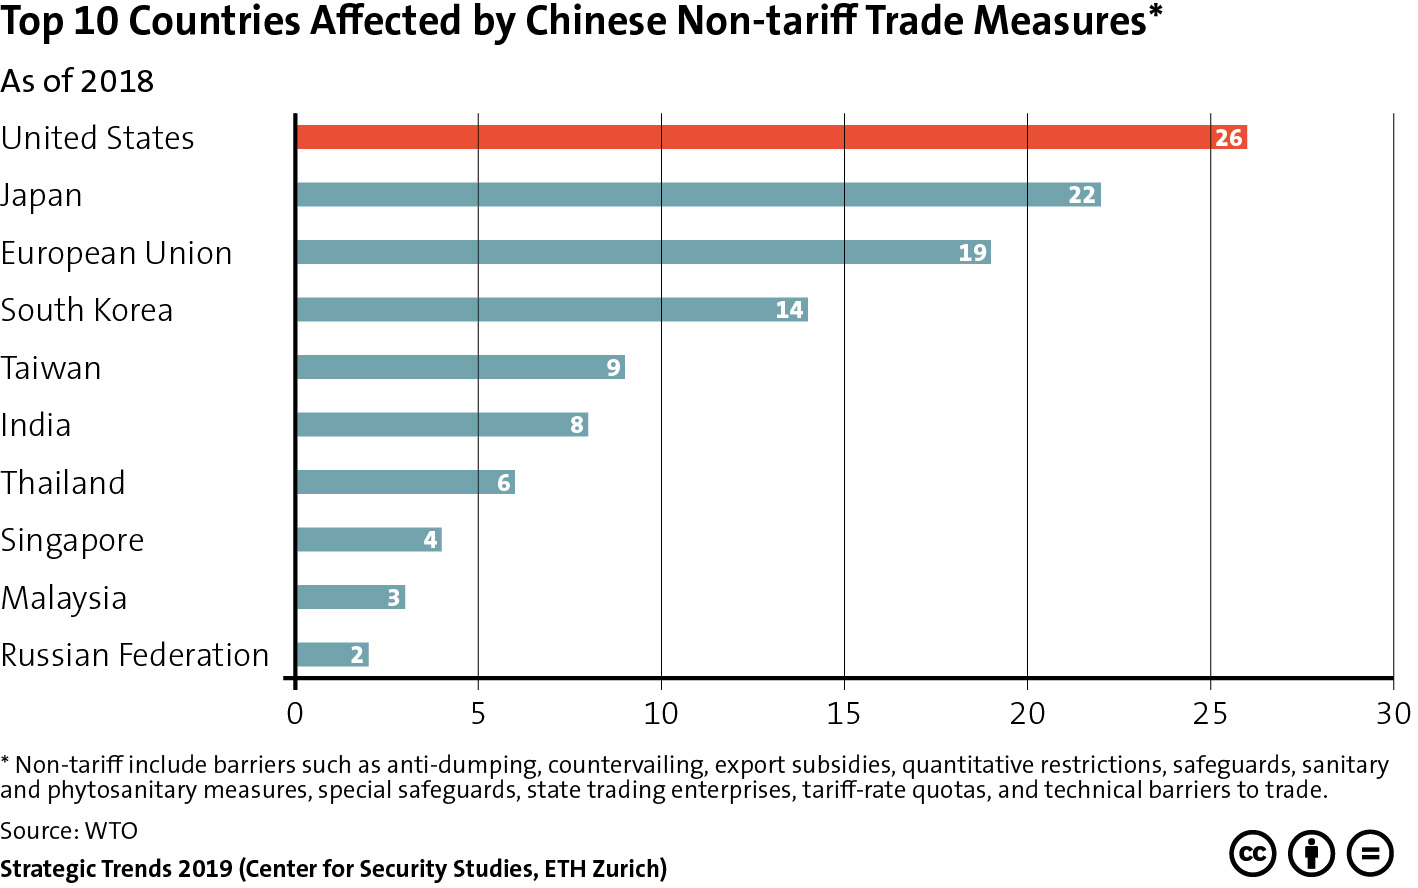
This week’s featured graphic charts the ten countries most affected by Chinese non-tariff trade measures as of 2018, with the US topping the list. For an analysis of how this has influenced the trade policy of the Trump administration, read Jack Thompson’s chapter for Strategic Trends 2019 here.
Tag: Tariffs

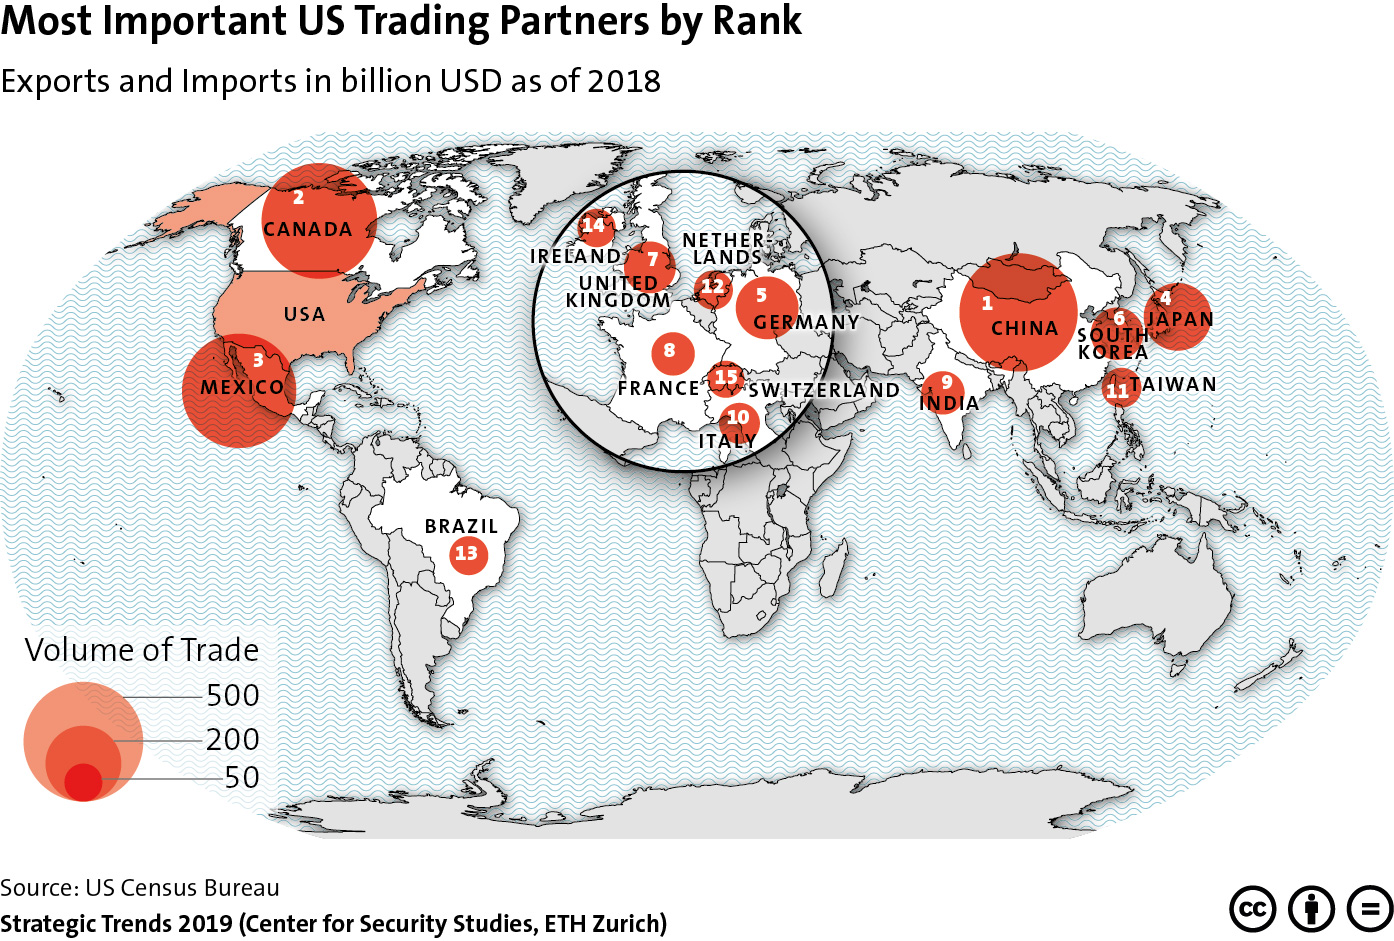
This graphic maps and ranks the US’ most important trading partners by trade volume. For an analysis of how this ranking is reflected in the Trump administration’s approach to trade policy, read Jack Thompson’s new Strategic Trends 2019 chapter here. For more CSS charts, maps and graphics on economics, click here.


