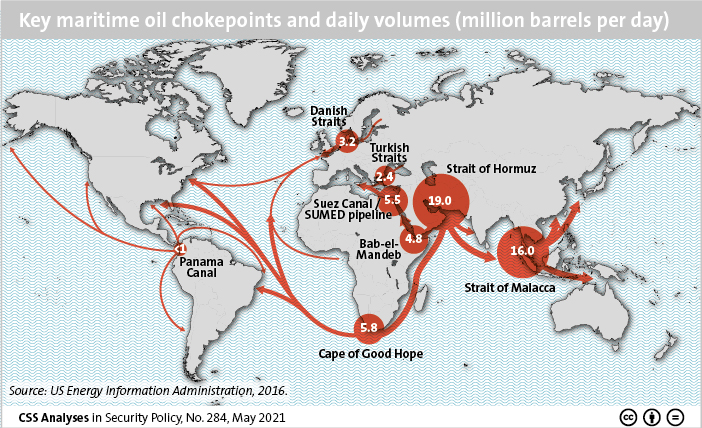
This week’s featured graphic maps key maritime oil chokepoints and daily volumes. For more on the Geostrategic Storm in the Indian Ocean read Boas Lieberherr’s CSS Analysis in Security Policy here.
Category: CSS Blog
The CSS Blog features the analyses of CSS experts, entries in the CSS Mediation Perspectives series and graphics produced by the CSS, which cover a range of international relations and security-related issues.
Arctic States and Stakes
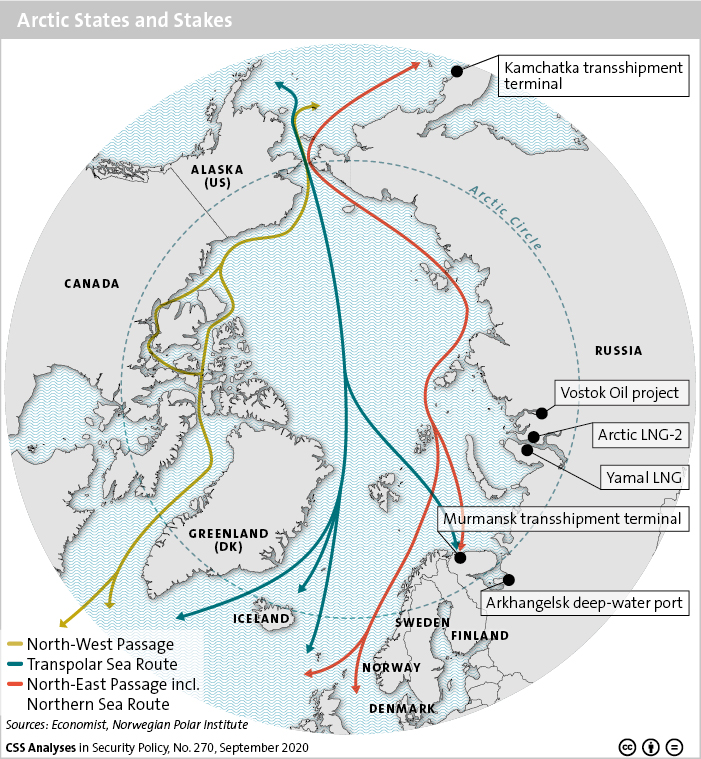
This graphic maps the countries located in the Arctic Circle, as well as its passages and sea routes. In the Arctic, Russia and China have their own ambitions, but their objectives currently overlap. Complementary economic interests are the main driver of their cooperation.
For more on the Sino-Russian dynamics in the Arctic, read Maria Shagina and Benno Zogg’s CSS Analysis in Security Policy here.
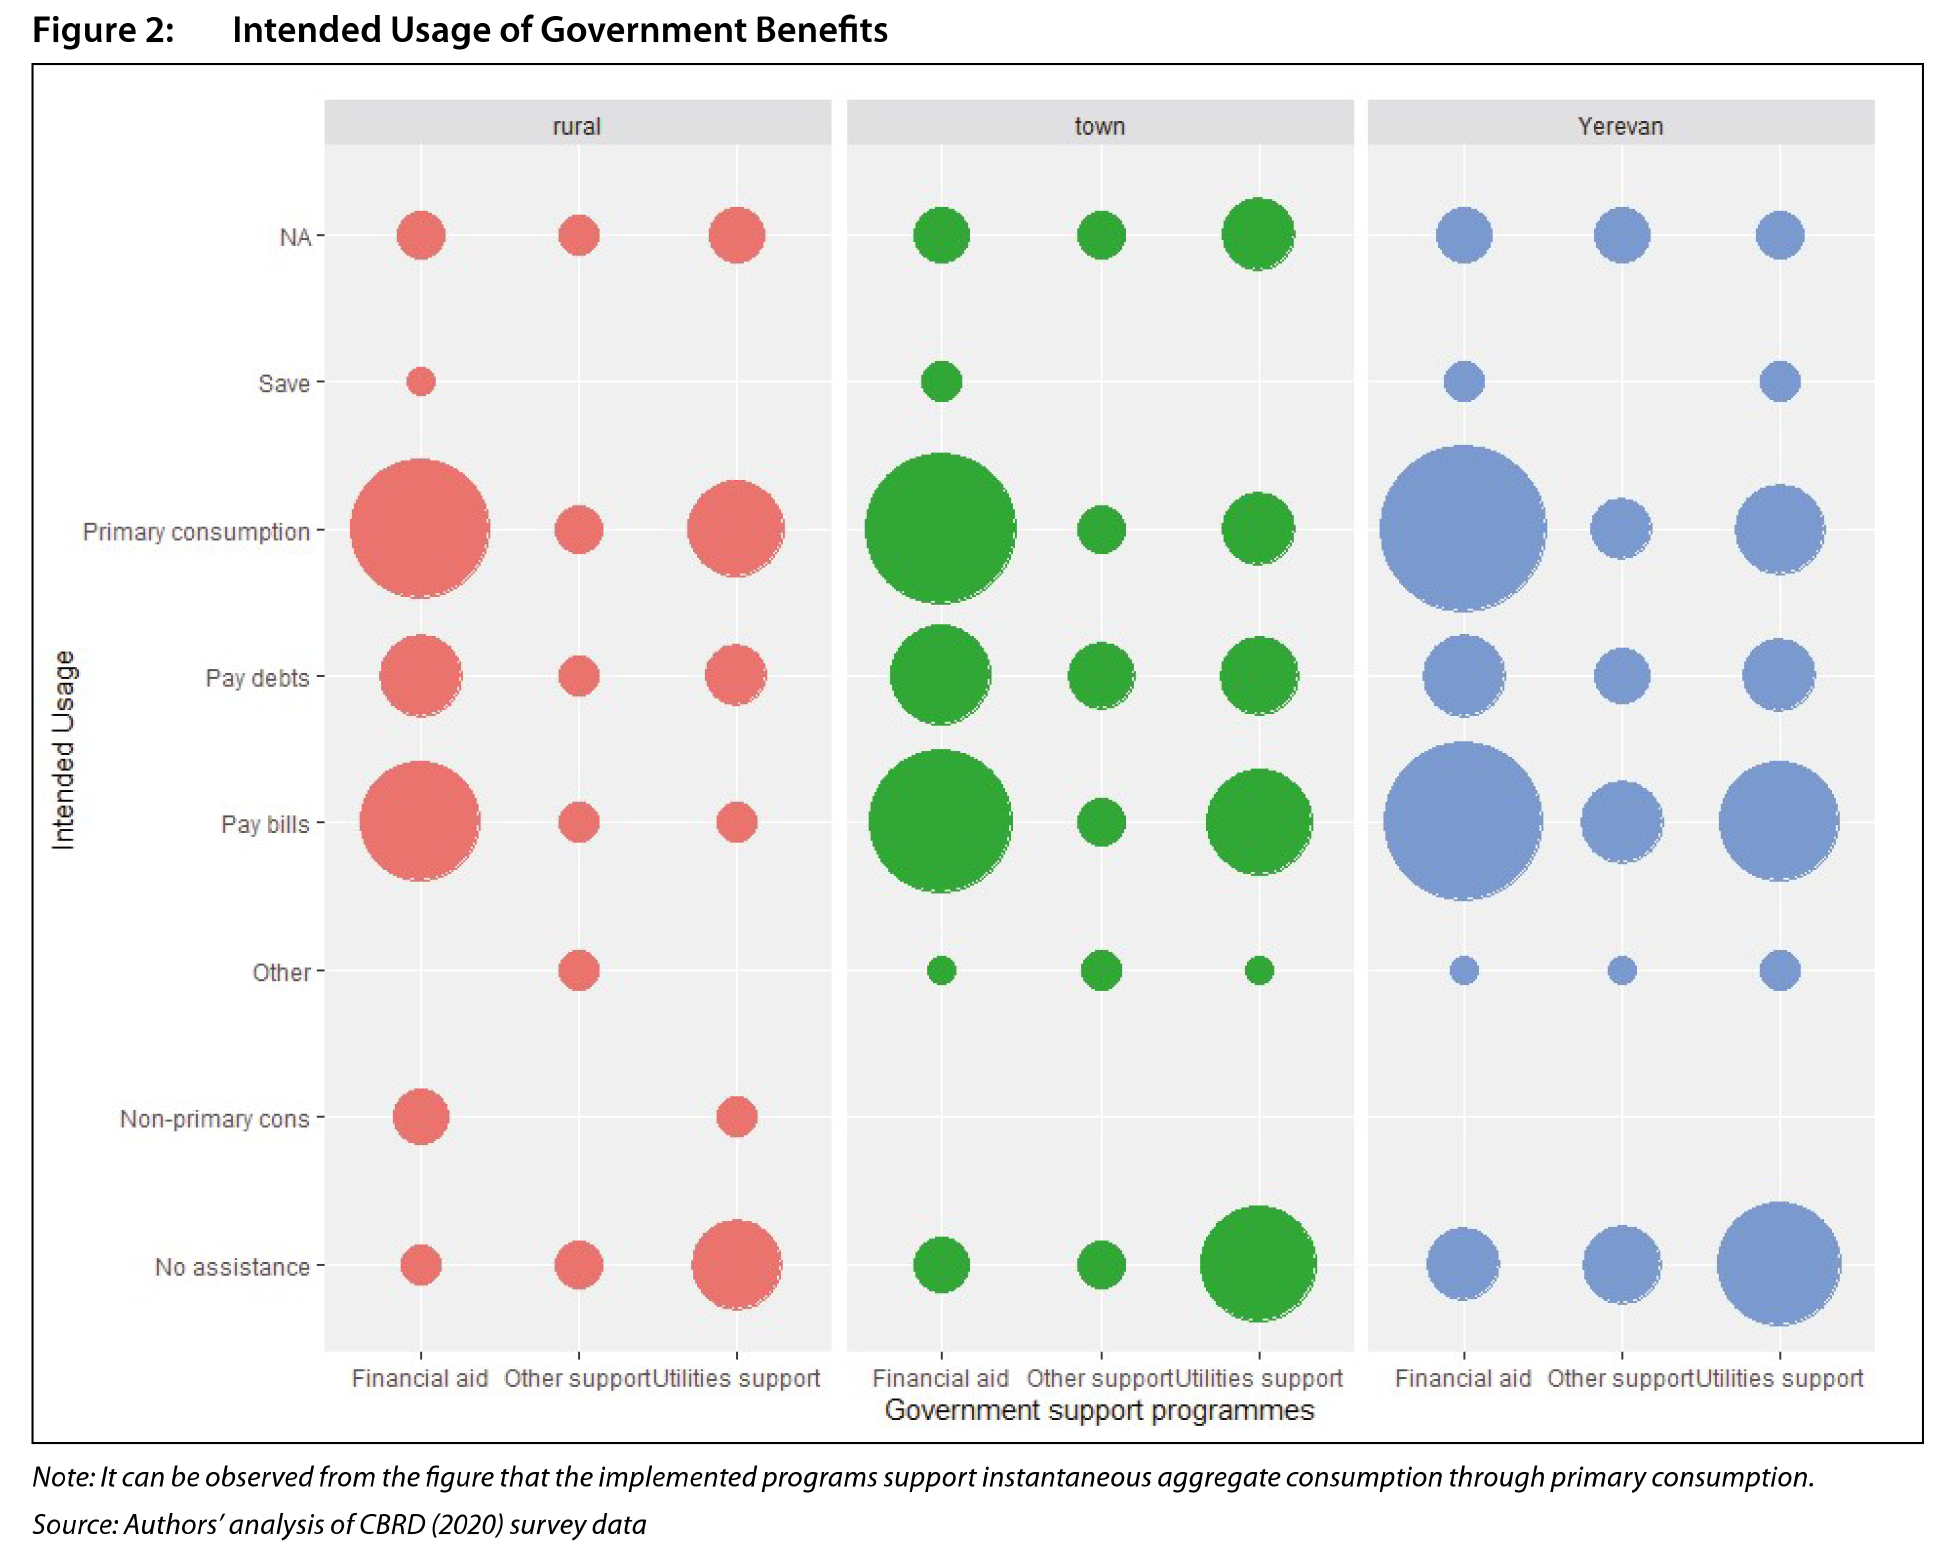
This graphic shows the intended usage of government benefits to address the impacts of the pandemic in Armenia. It can be observed that most assistance is directed towards consumption of primary goods and covering bills. Furthermore, it can be seen that in rural areas, as well as in the capital city Yerevan, social assistance programs covering utility bills substantially increased the consumption of primary products, an observation that may be attributed to the fungibility of money. Still, over 1.5% of the population claimed (at least as an intention) to save the funds. Meanwhile, a disproportionately high share of the announced usage of the funds is directed toward servicing debts, especially in urban areas outside Yerevan, where poverty levels are high.
For more on the mitigation of the social consequences of the COVID-19 pandemic in the three South Caucasus states of Armenia, Azerbaijan and Georgia, read this issue of the Caucasus Analytical Digest.
The Concept of Intersectionality
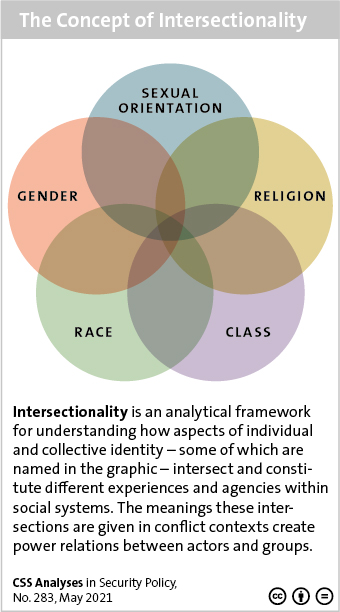
This week’s featured graphic shows the concept of intersectionality. To find out more on religion and gender in conflict, read Cora Alder’s CSS Analyses in Security Policy here.
This week’s featured graphic maps the nations in which major cyber theft incidents were initiated and countries affected by these attacks between 2000 and 2018. To find out what this highlights about the eclipse of Western military-technological superiority, read Michael Hass’ chapter for Strategic Trends 2019 here.