Categories
CSS Blog

The Return of Geopolitics from a US Perspective

EmailFacebookTwitter

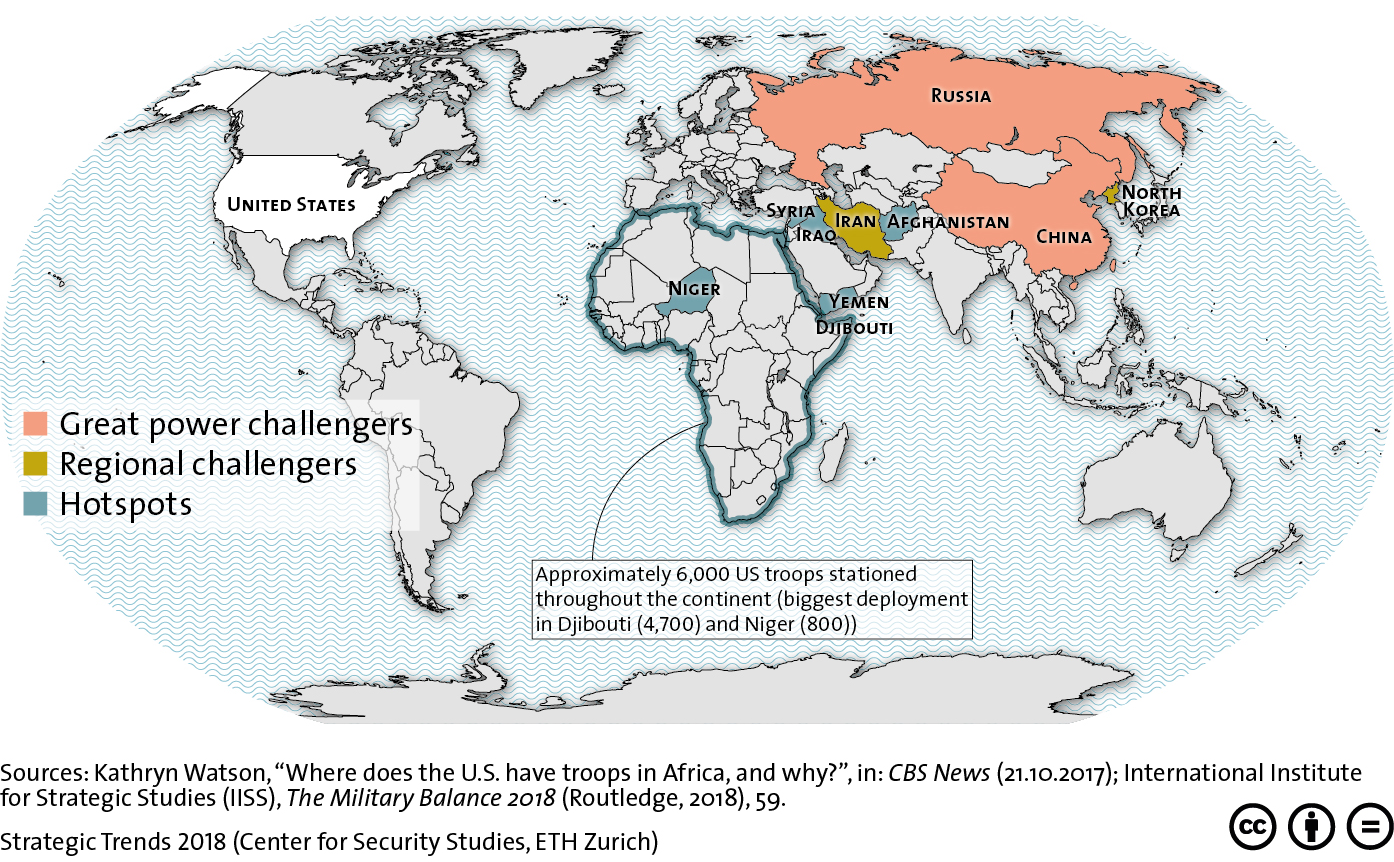
This graphic maps the great power and regional challengers to the US as well as key geopolitical hotspots of concern to Washington. For more on the domestic and international constraints threatening the US’ global leadership role, see Jack Thompson’s chapter for Strategic Trends 2018 here. For more CSS charts, maps and graphics on defense policy, click here.

Categories
CSS Blog

Russian Opinion Polls

EmailFacebookTwitter

This graphic depicts polling data on voter attitudes in Russia regarding the future course of Moscow’s domestic and foreign policy, collected prior to the country’s March 2018 presidential elections. To find out more about the current political situation in Russia, including how President Vladimir Putin has managed to maintain his high approval ratings, see Jeronim Perović’s recent addition to the CSS’ Analyses in Security Policy series here. For more CSS charts and graphs, click here.

Categories
CSS Blog

Landing Stations of Submarine Cables in the US and China

EmailFacebookTwitter

This graphic maps the various landing stations of submarine cables in both the US and China. To find out about cybersecurity in Sino-American relations, see Marie Baezner’s recent addition to the CSS’ Analyses in Security Policy series here. For more CSS charts and graphs on defense policy, click here.

Categories
CSS Blog

Foreign Fighters who Travelled to Syria and Iraq Since 2011

EmailFacebookTwitter

This graphic traces both the numbers of foreign fighters who traveled to Syria and Iraq from North African countries, as well as those who have returned to their country of origin or residence since 2011. To find out more about North Africa’s foreign fighters, see Lisa Watanabe’s recent addition to our CSS Analyses in Security Policy series here. For more graphics on peace and conflict, see the CSS’ collection of graphs and charts on the subject here.

Categories
CSS Blog

Electoral Turnout in Russian Presidential and Parliamentary Elections, 1991 – 2016

Data sources: International Institute for Democracy and Electoral Assistance, at <https://www.idea.int/data-tools/data/voterturnout>, Central Electoral Commission of Russia, at <http://www.izbirkom.ru/region/izbirkom>, and the CD-rom Rossiiskievybory v tsifrakh i kartakh (Mercator and IGRAN 2007).

EmailFacebookTwitter

This graphic tracks overall voter turnout in Russian presidential and parliamentary elections from 1991 to 2016. To find out more about voter turnout trends and electoral mobilization in Russian federal elections, see Inga Saikkonen’s contribution to the latest edition of the Russian Analytical Digest here. To check out the CSS’ full collection of graphs and charts, click here.