Categories
CSS Blog

Countries that Experienced Armed Conflicts with Religious Dimensions in 2016

EmailFacebookTwitter

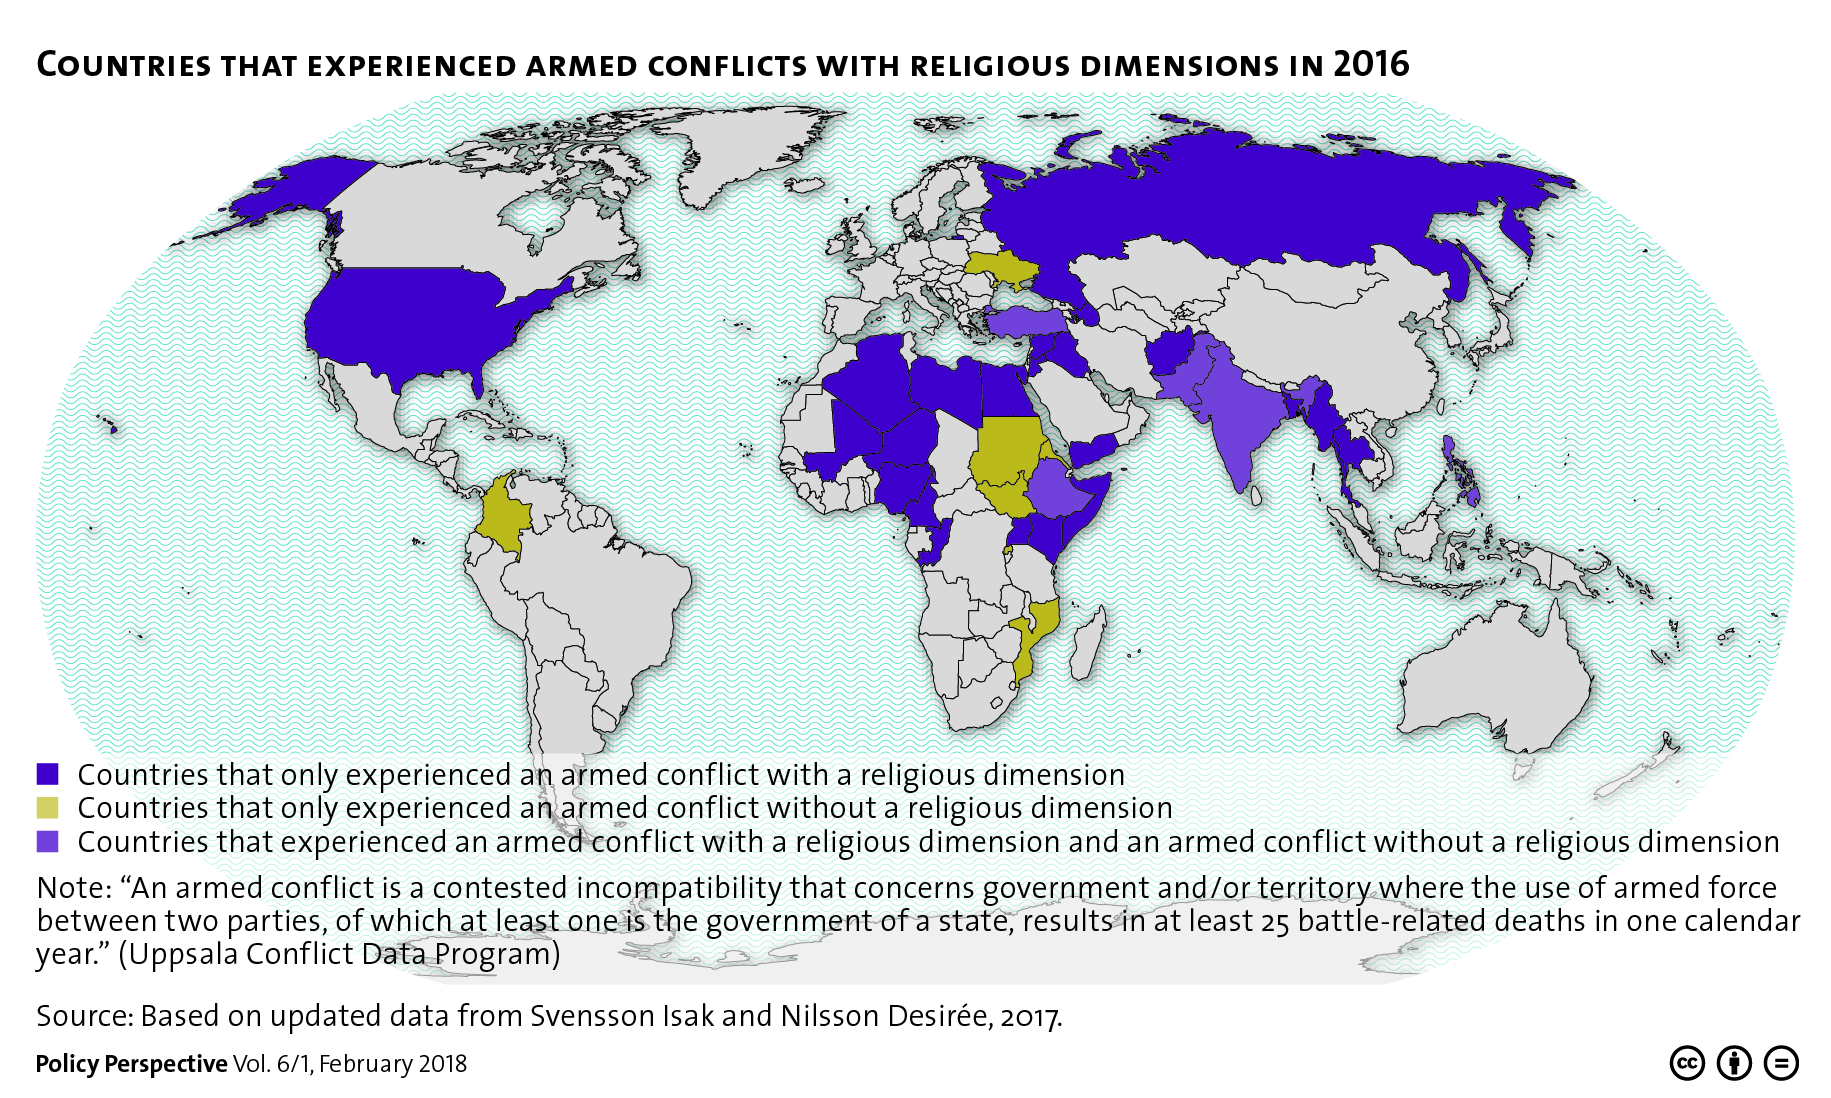
This graphic maps out the various countries that experienced armed conflicts with religious dimensions in 2016. To find out more about the role of religion in armed conflict, check out Jonas Baumann, Daniel Finnbogason and Isak Svensson’s newest addition to our CSS Policy Perspectives here. For more graphics on peace and conflict, check out the CSS’ collection of graphs and charts on the subject here.

Categories
CSS Blog

Number of Armed Conflicts Worldwide by Type, 1975-2015

EmailFacebookTwitter

This graphic presents a breakdown of different types of armed conflict occurring worldwide from 1975-2015. To find out more about the role of religion in armed conflict, check out Jonas Baumann, Daniel Finnbogason and Isak Svensson’s newest addition to our CSS Policy Perspectives here. For more graphics on peace and conflict, check out the CSS’ collection of graphs and charts on the subject here.

Categories
CSS Blog

Current ICC Situations

EmailFacebookTwitter

This graphic provides a brief overview of the various situations currently under investigation by the International Criminal Court. For a more in depth look at the ICC and its efforts to prosecute human rights violations, see Céline Barmet’s recent CSS Analyses in Security Policy paper here. For more graphics on international organizations, check out the CSS’ collection of graphs and charts on the subject here.

Categories
CSS Blog

Mapping the Conflict in Mali

Email Facebook Twitter

This graphic offers a geographical overview of the various international security actors in Mali’s ongoing struggle with widespread insecurity and Islamist extremism. To read more about the conflict as well as Switzerland’s efforts to support the Mali’s fragile peace, see Allison Chandler and Benno Zogg’s recent CSS analysis here. For more graphics on peace and conflict, check out the CSS’ collection of graphs and charts on the subject here.

Categories
CSS Blog

Oil Market 2012-2017

This graphic maps key indicators of the oil market in between 2012 – 2017. For more information on which trends will shape the oil market, check out this CSS analysis by Severin Fischer. For more graphics on natural resources, check out the CSS’ collection of graphs and charts on the subject here.