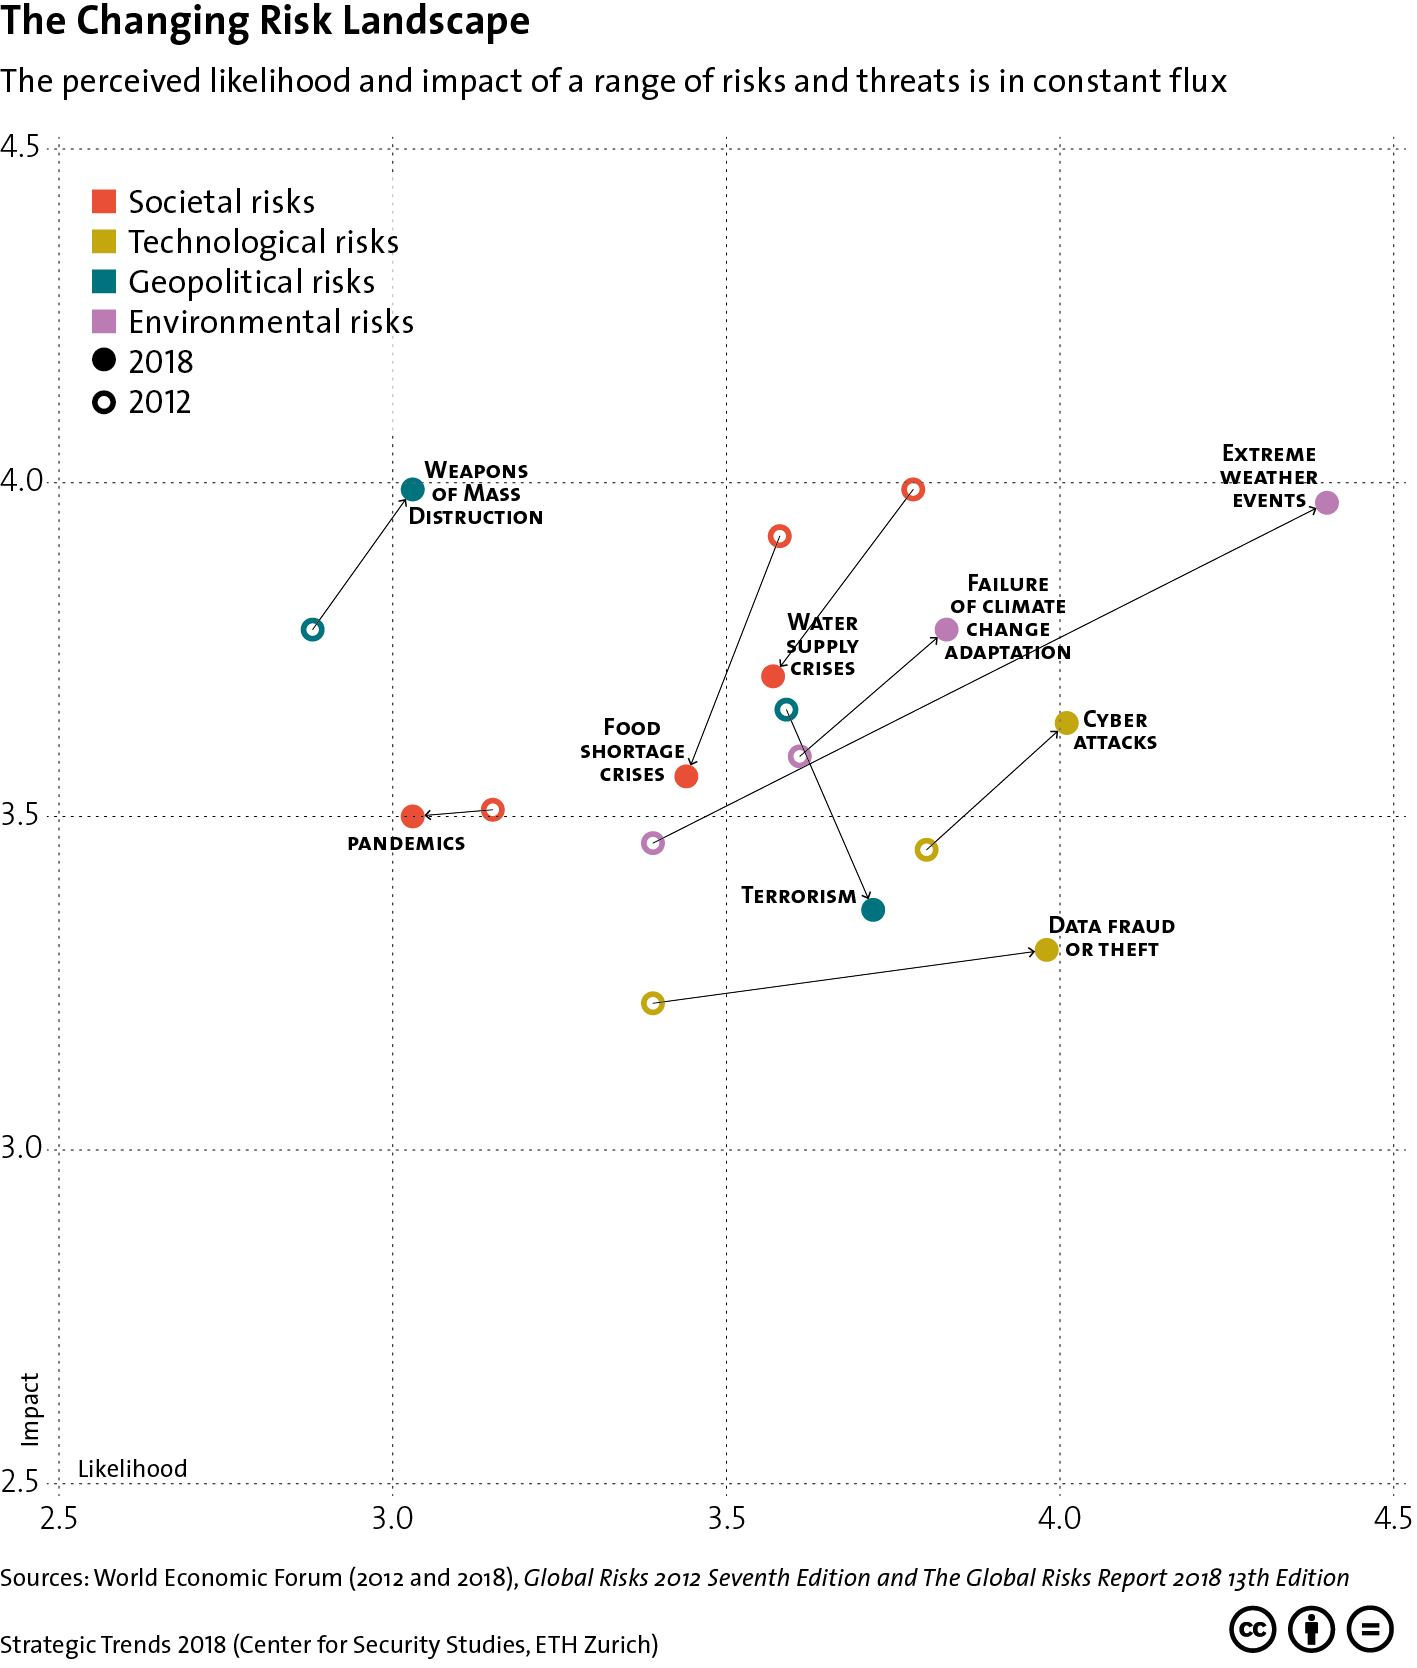
This graphic plots the change in the perceived likelihood and impact of various societal, technological, geopolitical and environmental risks between 2012 and 2018. For more on resilience and the evolution of deterrence, see Tim Prior’s chapter for Strategic Trends 2018 here. For more CSS charts, maps and graphics on risk and resilience, click here.


