This article was originally published by the European Union Institute for Security Studies (EUISS) on 1 March 2017.
The first EUISS Security Monthly Stats (SMS) brings together defence data from the International Institute for Strategic Studies (IISS) and the Stockholm International Peace Research Institute (SIPRI) from 2016. Aggregating figures from the 28 EU member states, the graphics answer a series of questions about defence spending levels and arms exports.
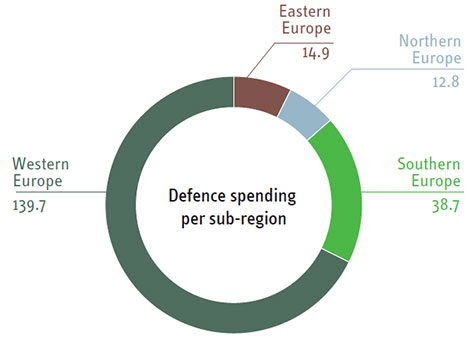
How much did the EU-28 spend on defense in 2016?
Eastern Europe: Bulgaria, Czech Republic, Hungary, Poland, Romania, Slovakia
Northern Europe: Denmark, Estonia, Finland, Latvia, Lithuania, Sweden
Southern Europe: Croatia, Cyprus, Greece, Italy, Malta, Portugal, Slovenia, Spain
Western Europe: Austria, Belgium, France, Germany, Ireland, Luxembourg,
Netherlands, UK
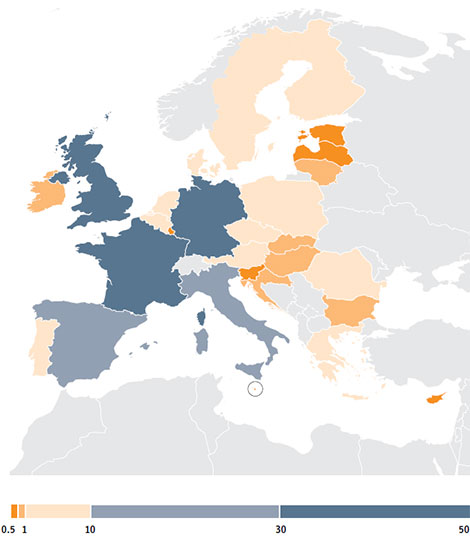
14 EU member states have increased defence spending as a share of GDP since 2014
3 EU member states account for over 60% of EU-28 defence spending
EU-28 defence spending

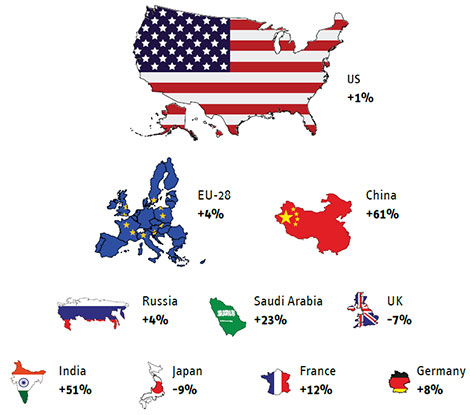
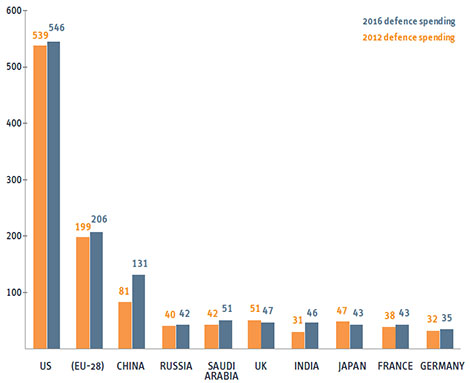
Who are the largest defence spenders around the globe? (2012 vs 2016 levels)
(current € billions)
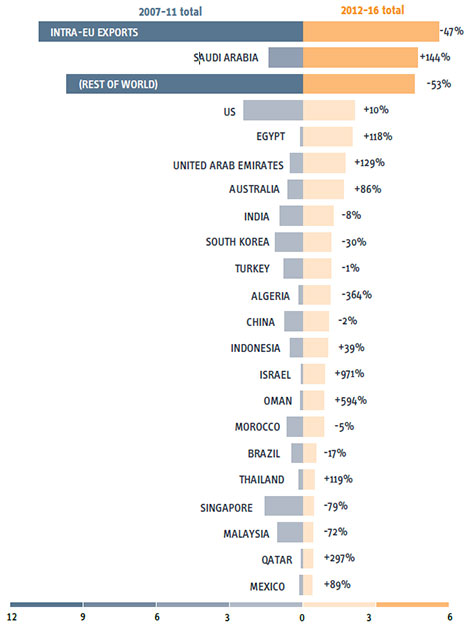
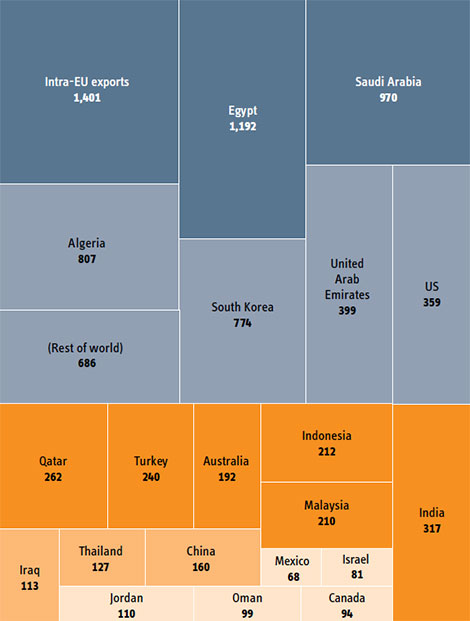
When accounting for inflation, EU-28 defence spending in current prices has increased over the past five years. The US maintains its position as the world’s largest defence spender, and three EU member states remain in the top ten. With regards to arms exports figures, transfers to Middle East and North Africa (MENA) countries have significantly increased at the same time as EU-28 arms exports to fellow member states have almost halved. In 2016, the volume of EU-28 arms exports to the ten MENA countries highlighted in the graphics below was approximately the same as the volume of exports to the rest of the world.
What are the top destinations of EU-28 arms exports?
(1990 constant $ millions)
From a 10 year perspective…
…to 2016 levels
Methodological note: IISS data are converted into euro using annual average exchange rates from the Statistical Data Warehouse of the European Central Bank. For the international comparison, the five-year perspective is also based on the annual average inflation rates for the 18-countries eurozone (prior to Lithuania adopting the euro) from the European Commission.
About the Author
Zoe Stanley-Lockman is a Defence Data Research Assistant at the European Union Institute for Security Studies (EUISS).
For more information on issues and events that shape our world, please visit our CSS Security Watch Series or browse our Publications.
