Categories
CSS Blog

Top 5 Trading Partners of Algeria and Egypt

EmailFacebookTwitter

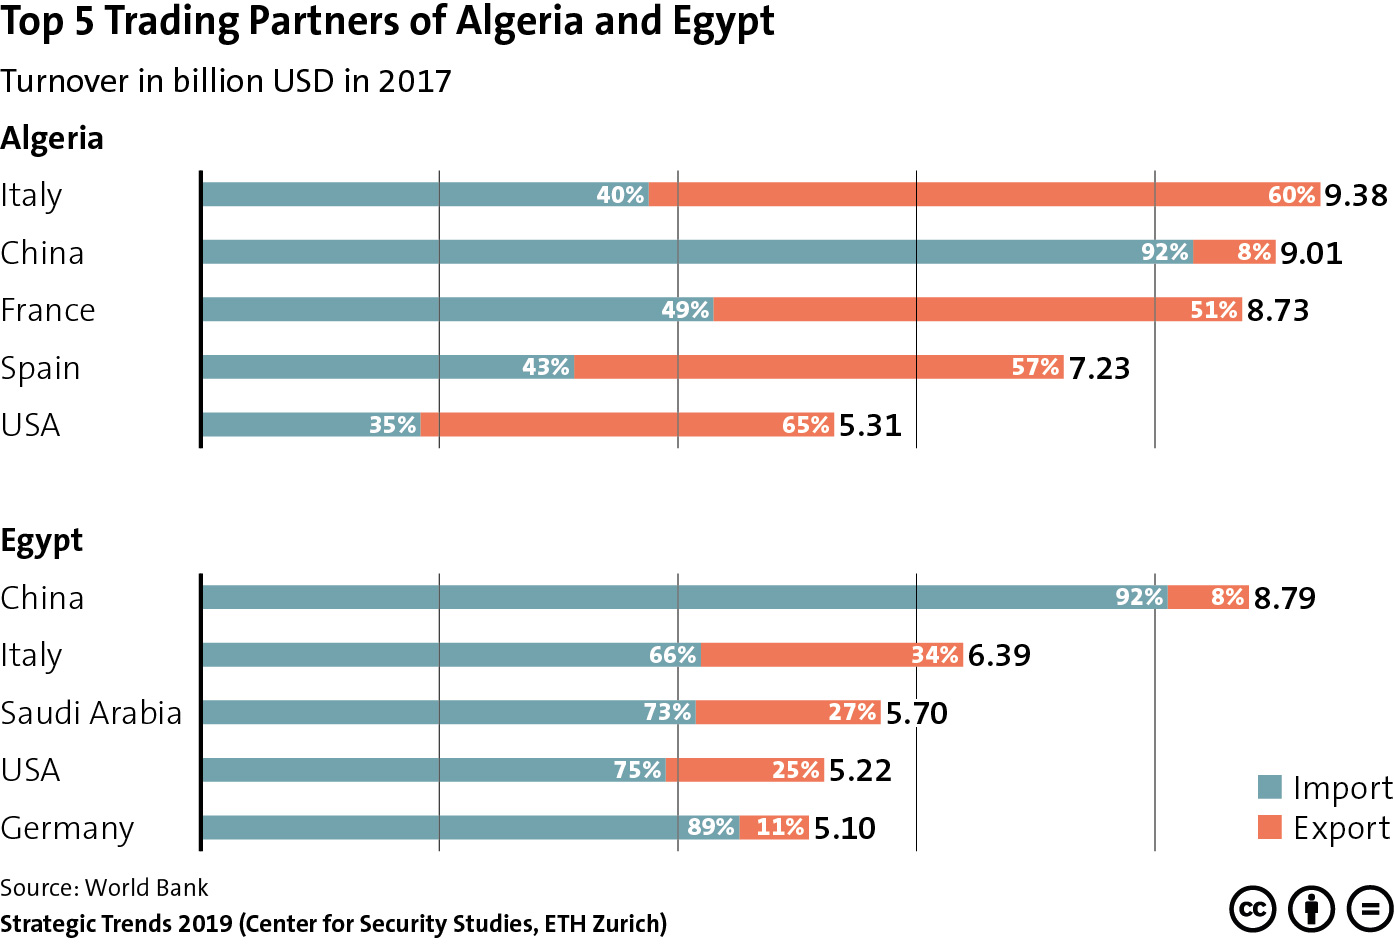
This week’s featured graphic provides an overview of Algeria and Egypt’s top trading partners. Russia’s absence from the top five trading partners list of either country highlights that despite Moscow’s revival of its ties with Cairo and Algiers, it remains overshadowed by other actors in the economic sphere. To find out more about Russia’s strategy in the Middle East and North Africa, read Lisa Watanabe’s chapter for Strategic Trends 2019 here.

Categories
CSS Blog

External and Internal Trade: The EU and the EAEU Compared

EmailFacebookTwitter

This graphic shows how the the overall level of internal trade among the member states of the Eurasian Economic Union (EAEU) remains relatively low at 14.6 percent, especially when compared to the European Union (EU), where around 64 percent of trade was between members in 2017. The graphic also shows the percentage of external trade for both unions. For an insight into Russia’s policy towards the EAEU and how this fits into Moscow’s Eurasian strategy, see Jeronim Perović’s chapter in Strategic Trends 2019 here.

Categories
CSS Blog

Top 10 Countries Affected by Chinese Non-tariff Trade Measures


EmailFacebookTwitter

This week’s featured graphic charts the ten countries most affected by Chinese non-tariff trade measures as of 2018, with the US topping the list. For an analysis of how this has influenced the trade policy of the Trump administration, read Jack Thompson’s chapter for Strategic Trends 2019 here.

Categories
Coronavirus CSS Blog

Economic Ties Between EAEU Members in 2017

EmailFacebookTwitter

This graphic maps the volume of trade between members of the Eurasian Economic Union (EAEU), including Russia, Kazakhstan, Kyrgyzstan, Armenia and Belarus. For an analysis of the role the EAEU plays in Russia’s Eurasian strategy, see Jeronim Perović’s chapter in Strategic Trends 2019 here. For more CSS charts and graphics, click here.

Categories
CSS Blog

Tariff Levels: US and Key Trading Partners

EmailFacebookTwitter

This graphic outlines the average tariff levels applied on all imports by the US and a selection of its key trading partners. For an analysis of the Trump administration’s trade policies and the weaponization of international trade, see Jack Thompson’s chapter for Strategic Trends 2019 here. For more CSS charts and graphics, click here.