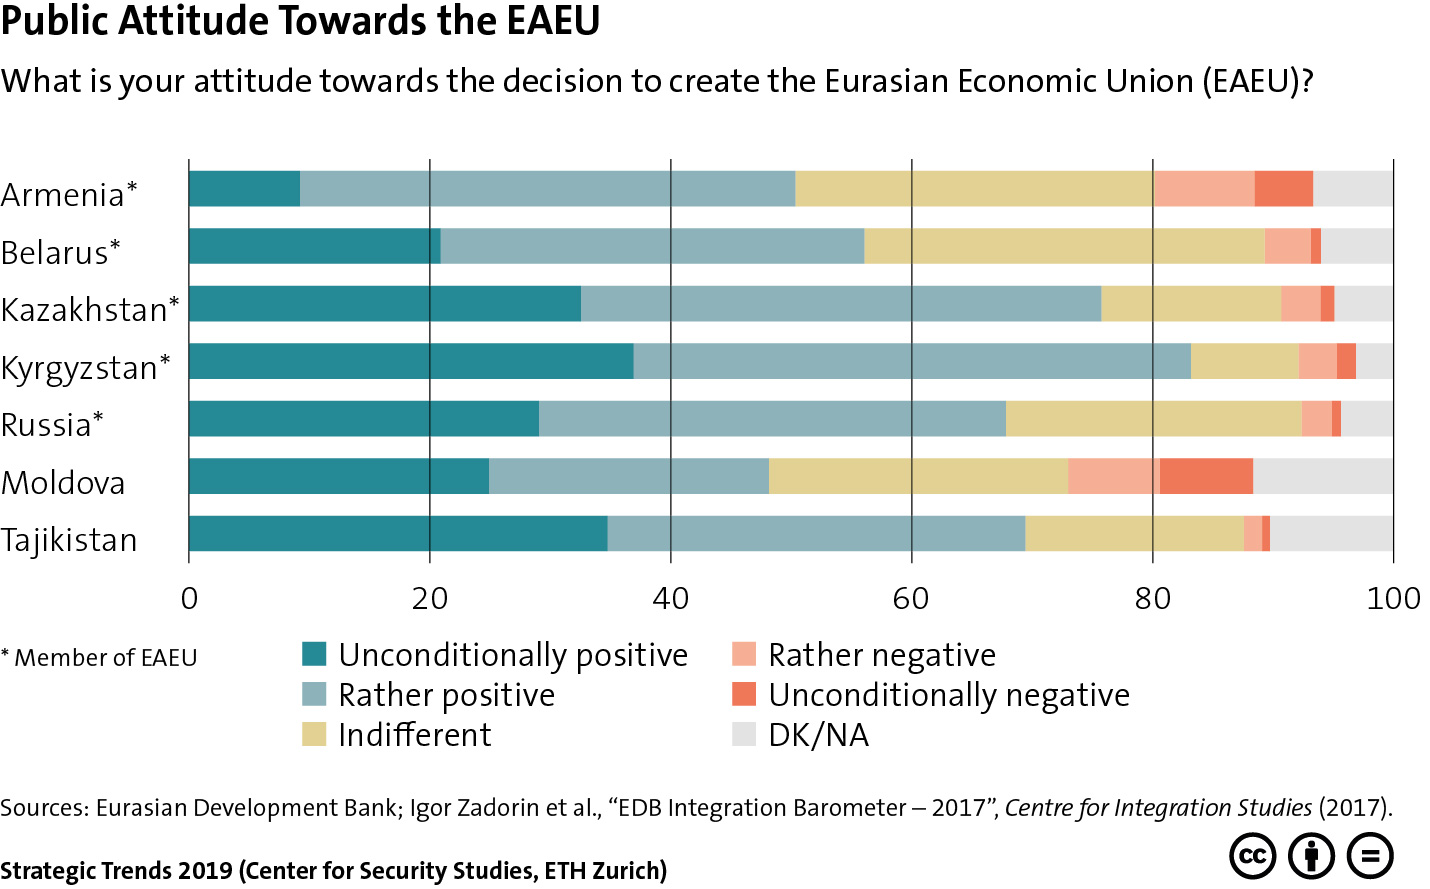
This graphic displays public attitudes in Eurasian Economic Union (EAEU) member states towards the creation of the organization. For an insight into the role of the EAEU in Russia’s Eurasian strategy, see Jeronim Perović’s chapter for Strategic Trends 2019 here.

Tag: Eurasian Economic Union
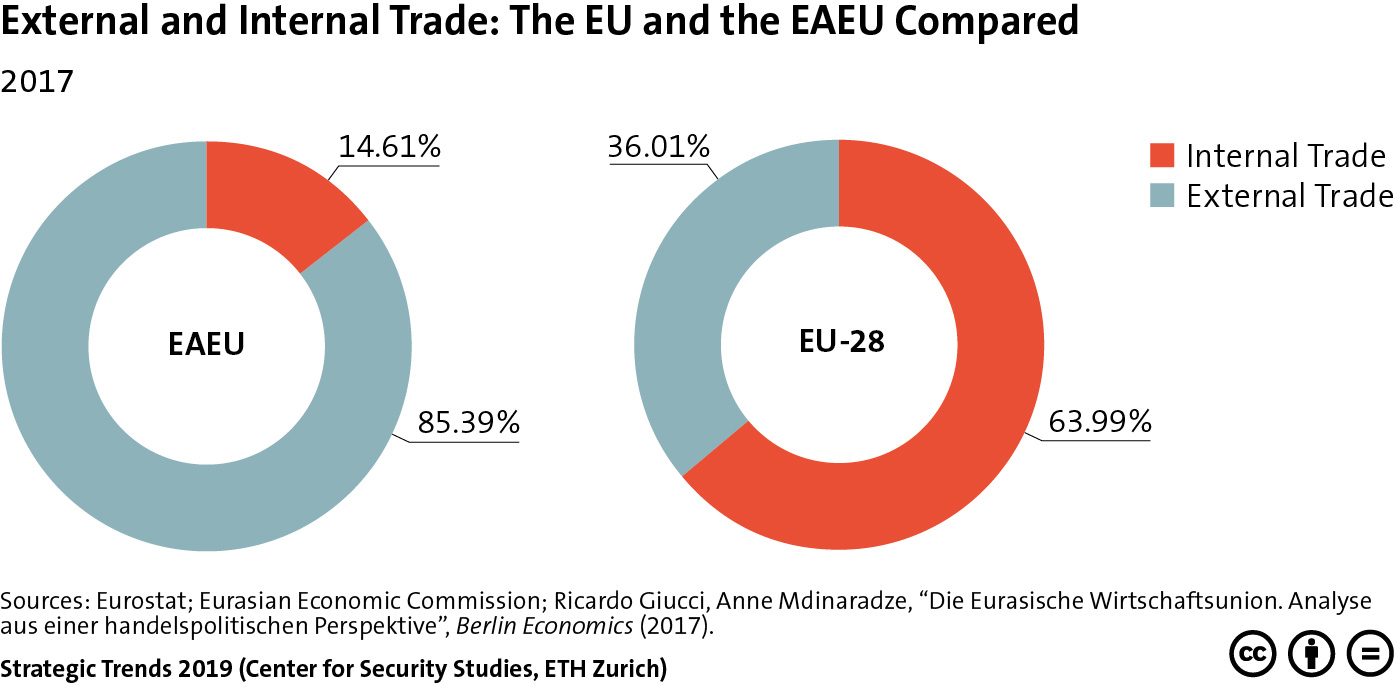
This graphic shows how the the overall level of internal trade among the member states of the Eurasian Economic Union (EAEU) remains relatively low at 14.6 percent, especially when compared to the European Union (EU), where around 64 percent of trade was between members in 2017. The graphic also shows the percentage of external trade for both unions. For an insight into Russia’s policy towards the EAEU and how this fits into Moscow’s Eurasian strategy, see Jeronim Perović’s chapter in Strategic Trends 2019 here.
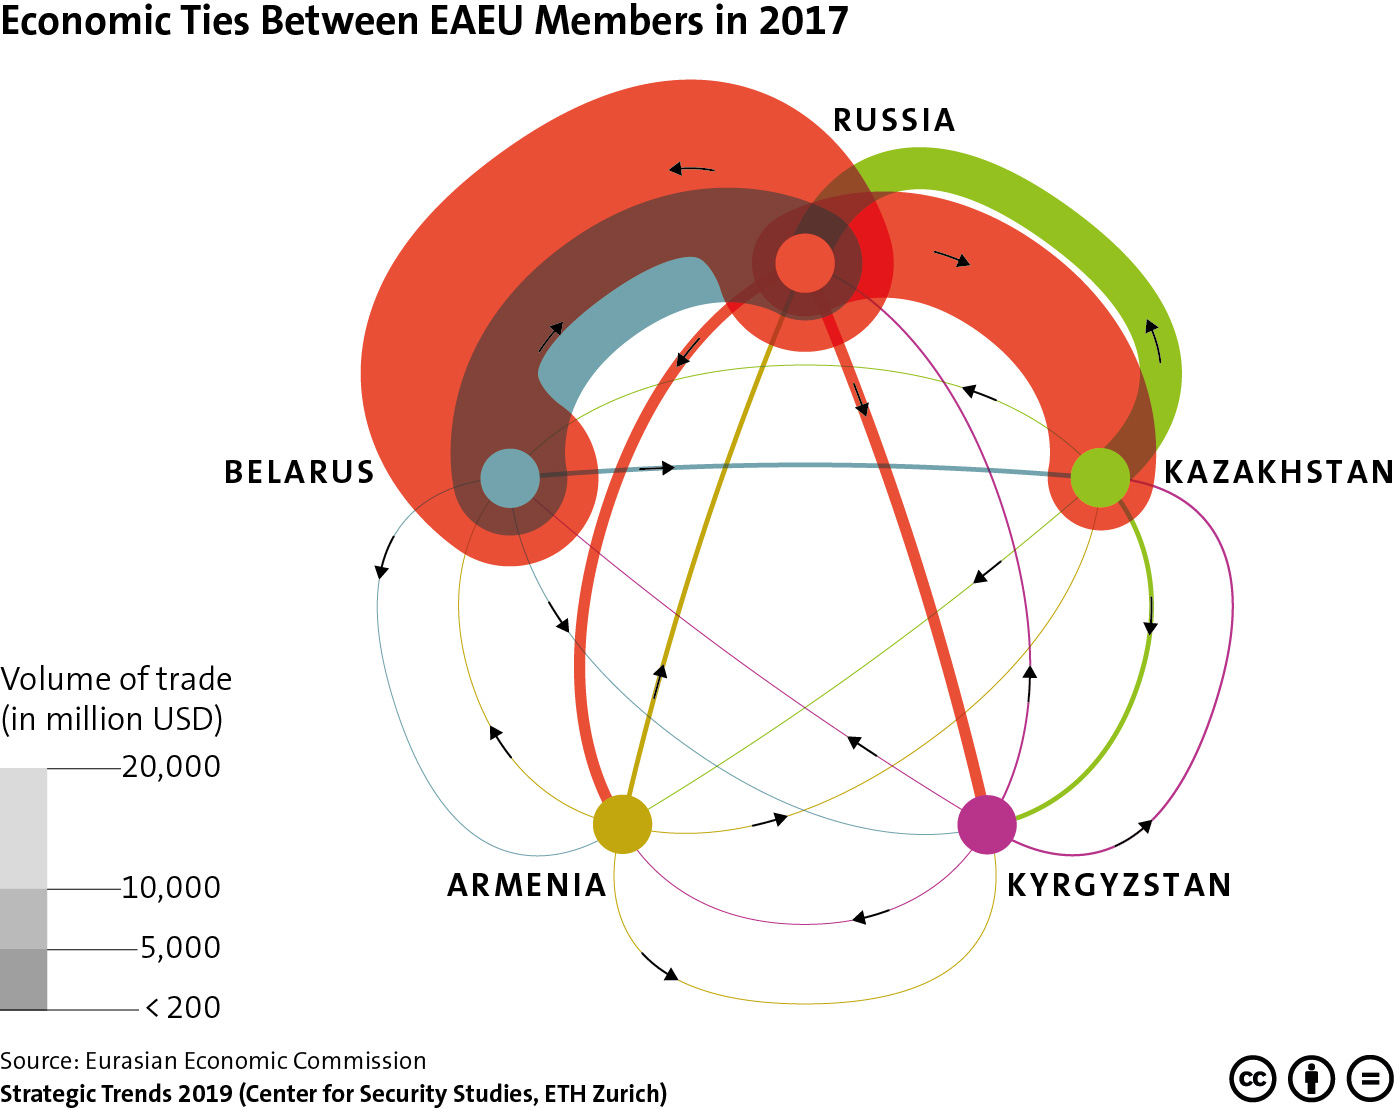
This graphic maps the volume of trade between members of the Eurasian Economic Union (EAEU), including Russia, Kazakhstan, Kyrgyzstan, Armenia and Belarus. For an analysis of the role the EAEU plays in Russia’s Eurasian strategy, see Jeronim Perović’s chapter in Strategic Trends 2019 here. For more CSS charts and graphics, click here.