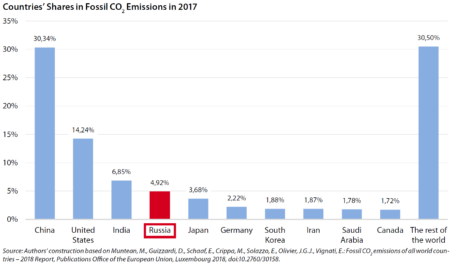
This image breaks down what percentage of CO2 emissions were produced by the top ten producing countries and how they compared to the rest of the world in 2017. To find out about the impact of climate change in Russia as well as debate on the issue in the country, see Russian Analytical Digest 243 ‘Climate Change and Russia‘.
Tag: Emissions
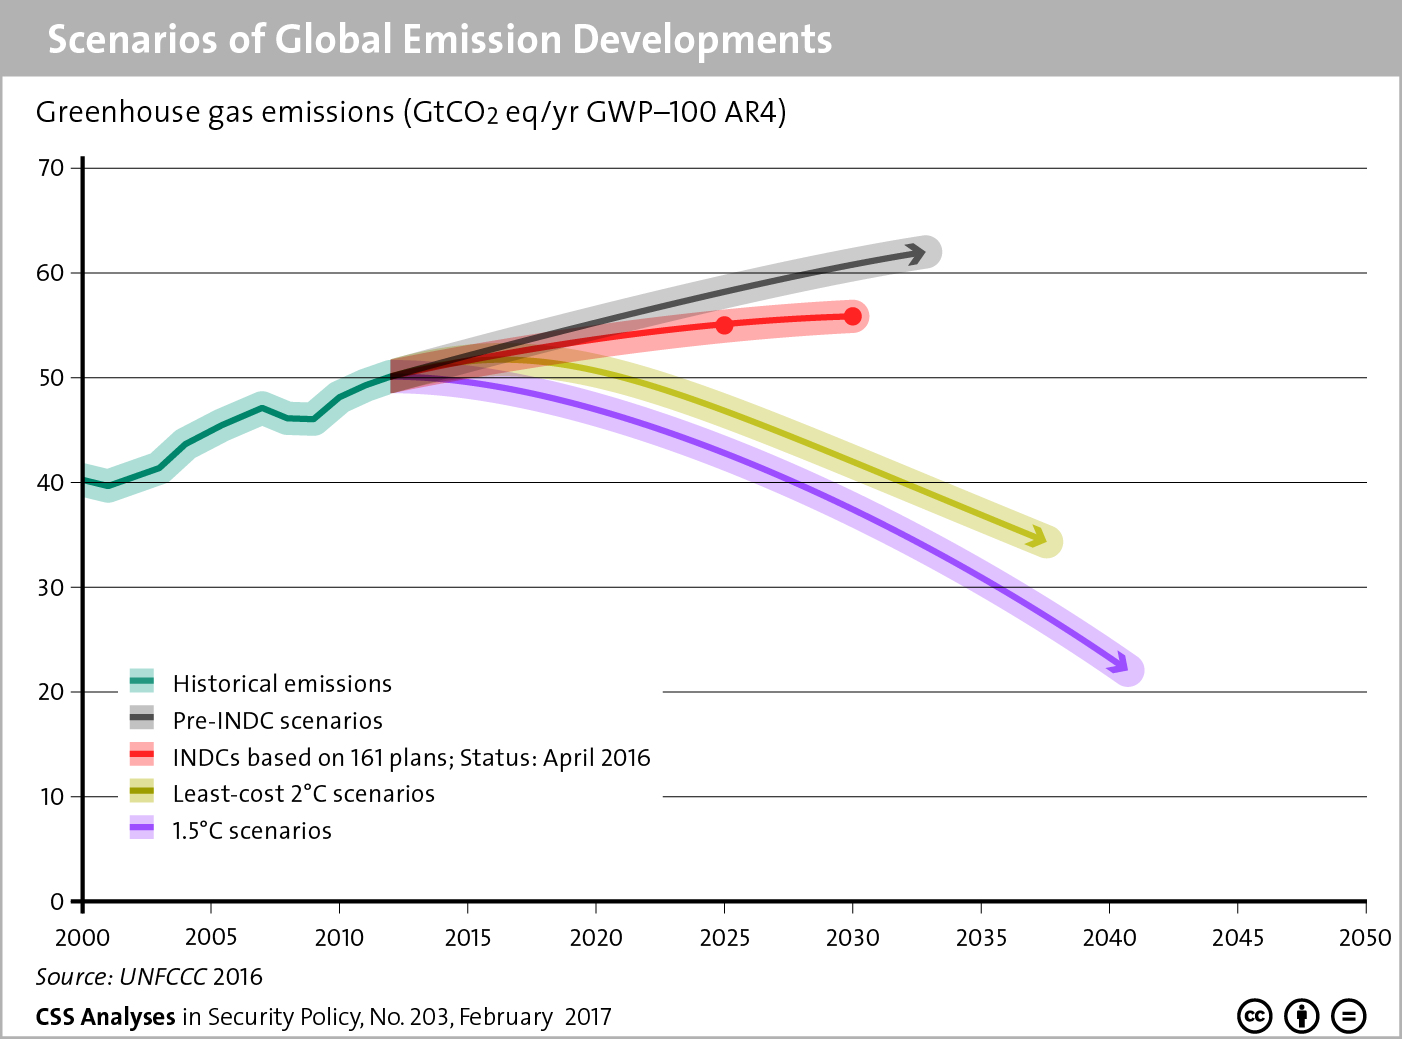
This graphic charts global emissions scenarios based on existing trends and increasingly ambitious climate targets. For more on how the Paris Agreement fundamentally realigned the structures of international climate policy, read Severin Fischer’s CSS Analyses in Security Policy here. For more CSS charts and graphics, click here.