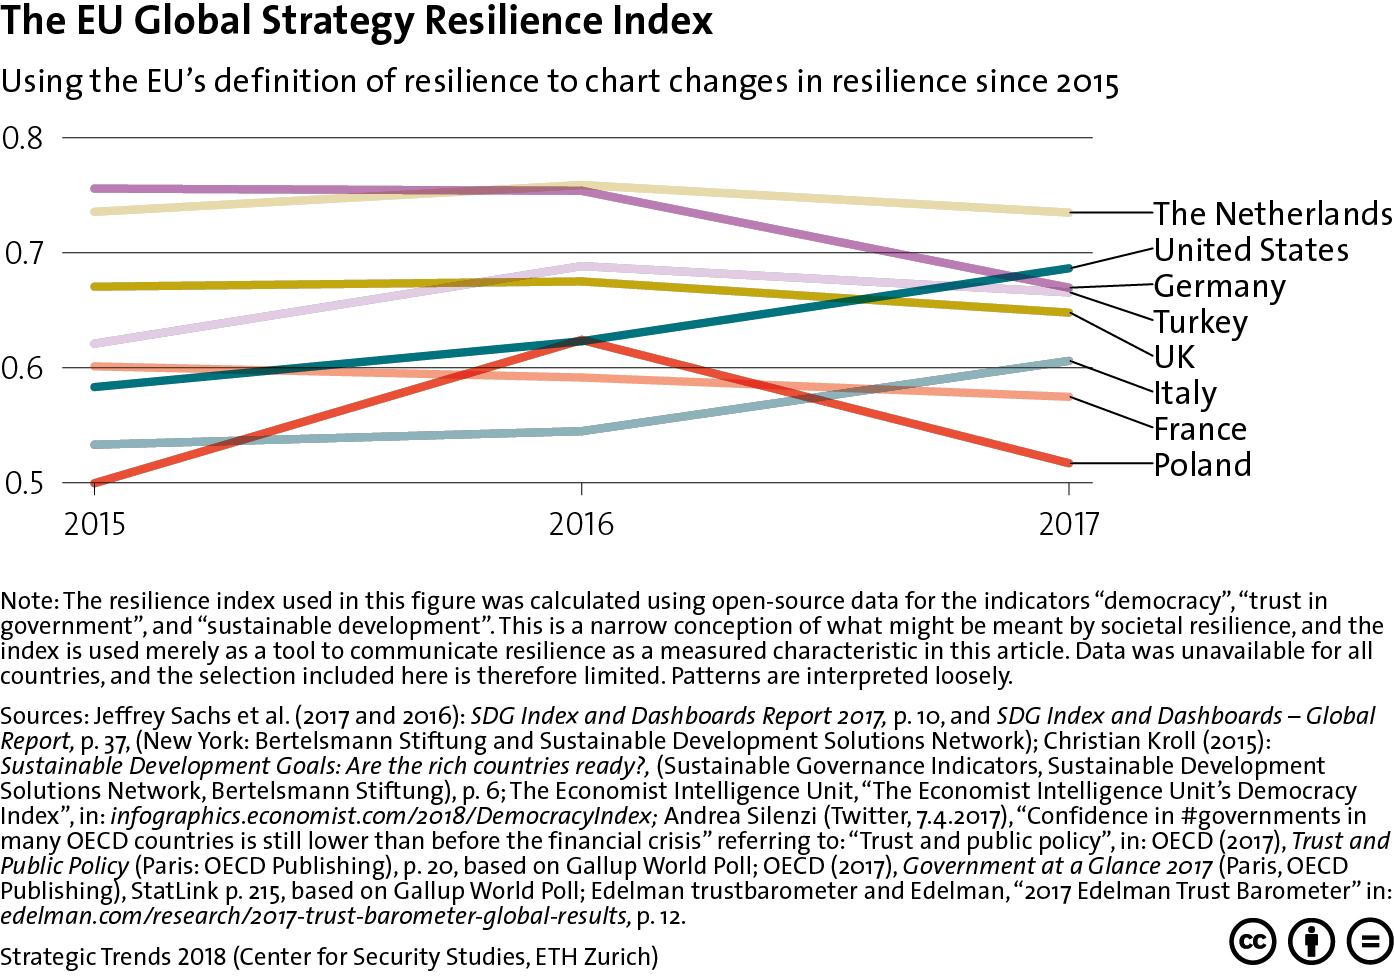
This graphic charts changes in resilience (using the EU’s definition of resilience) of select EU member states from 2015 to 2017. For more on the role of resilience in contemporary deterrence efforts, see Tim Prior’s chapter for Strategic Trends 2018 here. For more CSS charts, maps and graphics on defense policy, click here.


