
Economic development is generally measured by a country’s GDP. However, this hardly tells the whole story. While some countries might be very prosperous now, their future looks a lot different when the sustainability of their development path is taken into account. In the light of this week’s editorial plan topic Development: Describing and Prescribing Progress, this blog will introduce the ‘ecological footprint’ as a means to quantify the consequences of specific development paths.
The Ecological Footprint is an accounting metric which assesses humanity’s pressure on natural resources. It establishes how much land and water area a human population requires, to produce the resource it consumes and how much of the regenerative capacity of our planet we use to absorb emissions. Together with the measure of biocapacity, which tracks how much natural productive capacity is available to meet our demands, an ecological balance sheet for the world can be established. If the global ecological footprint is larger than global biocapacity, it means that humanity is using more than can be regenerated, and processed by the biosphere.
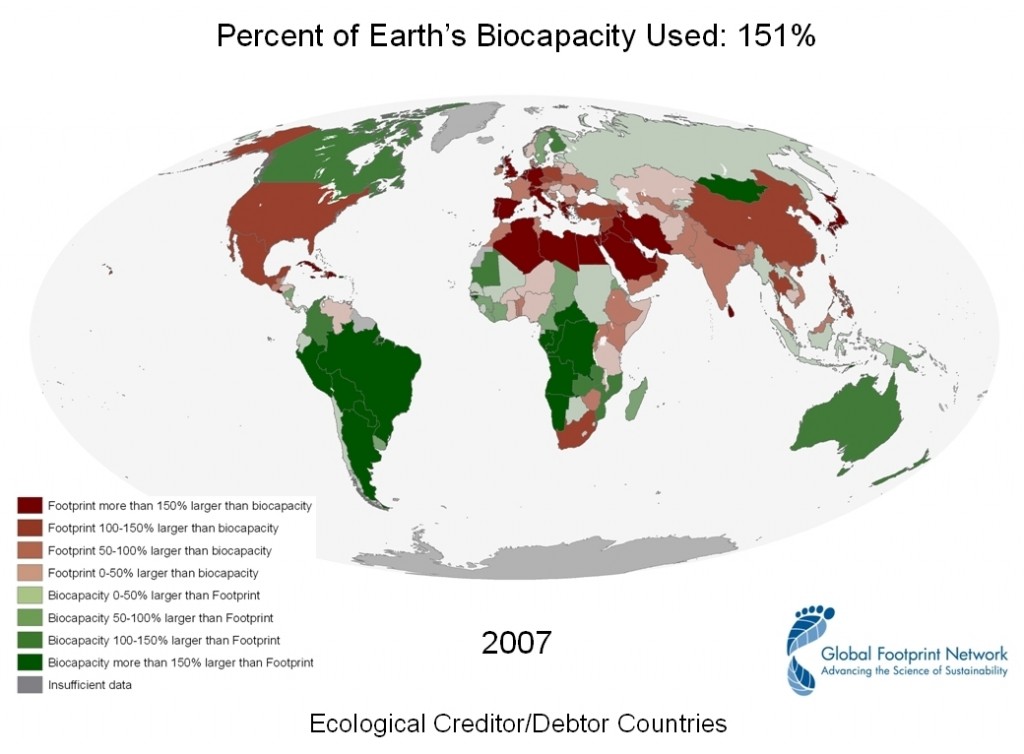
On the above map this is translated into different levels of ecological creditors, which have a smaller footprint than biocapacity; and ecological debtors, whose footprint exceeds their biocapacity. The map clearly shows a divide between the developed North and the less developed South. Only this time, the roles are inversed: the global South is doing relatively well, while the global North’s footprint is far larger than its biocapacity. Unfortunately, the effects of this ‘ecological overshoot’ by many Western countries are not limited to their borders. Phenomena like El Nino and desertification – both associated with ecological overshoot – are mostly felt in ecological creditor countries like Mongolia, Mali and Chile. This is, of course, not to say that the South does not make its own contribution to climate change. Indeed, Wheeler and Ummel have argued that the South would soon face a climate crisis even if the North and all its emissions had never existed.
By visualizing ecological depletion in this way, the Global Footprint Network seeks to initiate a dialogue on the growing significance of biocapacity. As the 2010 report of the network concluded, if we go on in the ‘business as usual’ scenario, even with modest UN projections for population growth, consumption and climate change, humanity will need the capacity of two Earths to absorb CO2 waste and keep up with natural resource consumption by 2030.
Fortunately, there are measures that can be taken to avert this rather gloomy scenario. The Global Footprint Network’s website offers a country’s ecological footprint data and interactive time-line graphics. Combined with the Human Development Index, goals can be set which help establish how much more we need to think ‘inside the box’. Wonder how big your ecological footprint is? Take the quiz and get tips on how to reduce it.
2 replies on “Development on its Head: the World Global Footprint”
Thanks for your comment, Silvio. I agree, maybe the ecological footprint is not primarily a tool to praise some countries and blame others. As you mentioned, the resources available in each country are an important factor in the equation. Plus, resources are arbitrarily distributed across the world, and it is partly a matter of good or bad luck how much each country’s got (the other part of the equation is how much of its biocapacity each particular country has already used).
But I think it is nevertheless a useful index, if only to get an overview of where the world is losing or wasting its biocapacity, where most biocapacity comes from, and how the world is doing as a whole. It can also useful for individual countries to improve their own footprint (I suppose most countries are wasting some biocapacity, and could therefore do better than they do now).
If you are interested in the topic, we just published a related blog post in which we ask whether human development can be sustainable: http://isnblog.ethz.ch/environment/contradicting-developments
Cheers!
I liked your article!
However, I would hesitate to call the green-shaded countries “better-doing”. It’s clear that the driving force behind the footprint statistic is the denominator, that is, the resources available. So, how could a desert country ever do well? Are the Maghreb states so much worse than, say, Canada or Australia (barely anyone there…)?
Of course, the same argument applies to the calculation of the GDP as well. Conditions differ all over the place, so it isn’t suitable to compare countries either.
But back to the footprint indicator: In my opinion it’s neither realistic nor desirable that Egypt (population density: 80/sq km, forest area: 0.07%) will ever perform in the same manner as Bolivia does (10/sq km, 53%). I guess that’s what trade is for.
The real problem is stated atop of the picture. 151% divided by one earth is still 151%.
Cheers!